Aside from our observation that the markets quite often get somewhat volatile on ‘Tuesdays’ yesterday was an interesting day from an intermarket stand point.
From Bloomberg, ‘The dollar erased losses against the euro after the Federal Reserve’s policy meeting minutes showed the central bank is holding off on increasing monetary stimulus.’ as well as, ‘Treasuries fell after minutes from the Federal Reserve’s last meeting showed policy makers are holding off on increasing monetary accommodation unless the U.S. economic expansion falters.
The reaction by the markets following the release of the minutes from the last FOMC meeting was… buy dollars and sell bonds. The dollar moved broadly higher while bond prices declined.
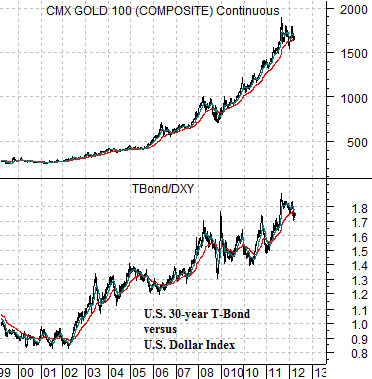
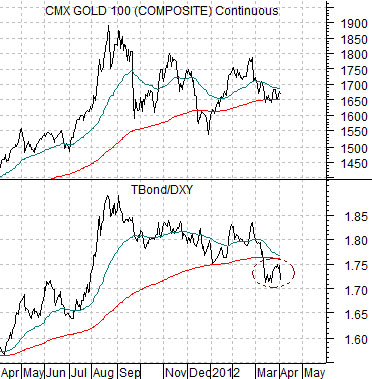
First below is a chart comparison between gold futures and the ratio between the U.S. 30-year T-Bond futures and the U.S. Dollar Index (DXY) futures.
The argument is that gold prices move with the ratio between the TBonds and dollar. Gold benefits from rising bond prices and does better with a weaker dollar. When bond prices are rising at the same time that the dollar is falling… gold prices tend to be quite robust.
So… if rising bond prices and a weaker dollar represent the best intermarket ‘driver’ for gold prices the opposite would then be true. The most bearish thing for gold is declining bond prices at the same time that the dollar is rising. Which, of course, is what happened in trading yesterday.
The next chart below features the same comparison over a shorter time frame. The peak for the TBond/DXY ratio was made in August of last year concurrent with the cycle highs for gold prices.
The point, we suppose, is that there has been just enough dollar strength and bond price weakness to flatten the trend for gold prices down around the 200-day exponential moving average line. From here it wouldn’t take much more than the U.S. Dollar Index climbing back above the 80 level with a flat to lower long-term Treasury prices to pull gold prices back below closing support in the 1650 region.
Equity/Bond Markets
Gold futures (April contract) closed the regular session at 1670 before tumbling in electronic trading down close to 1638. Last seen gold is 1646.
We point this out because our charts are based on the close of floor trading price which is 1670. For today this is going to skew a few of the gold-based charts.
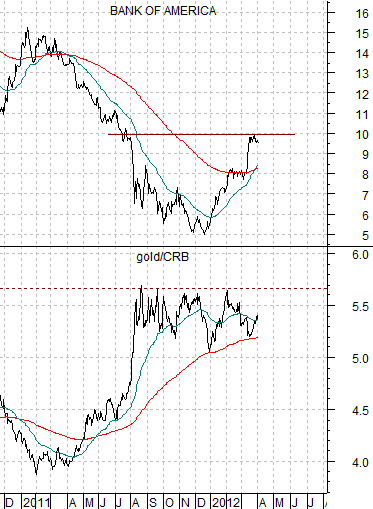
Below is a chart comparison between Bank of America (BAC) and the ratio between gold and the CRB Index.
The argument has been that gold is the inverse to the trend for the banking shares. The weaker the trend for gold the stronger the recovery for the banks.
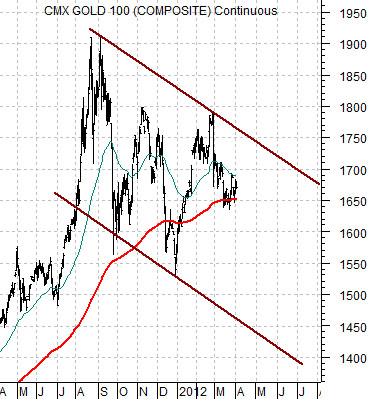
Middle below is a simple chart of gold futures. Our thought is that the outcome for the recovery will remain somewhat in doubt as long as gold is trading on the high side of its 200-day e.m.a. line. The longer-term trend is still positive although gold prices have been tracking lower since prices peaked last August.
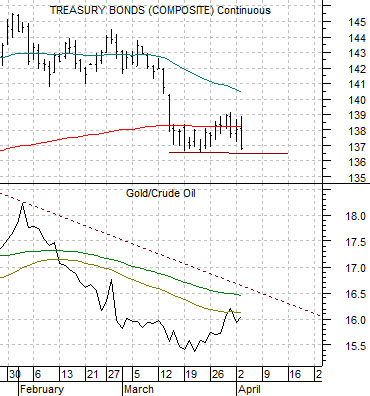
The last chart below shows the U.S. 30-year T-Bond futures and the ratio between gold and crude oil.
The basic point is that the TBonds trend with the ratio between gold prices and crude oil prices. Our view has been that bond prices are in a solid down trend with the caveat that if, as, or when oil prices break lower there will a period of upward pressure on the bond market. In other words… if gold prices decline by a greater percentage than oil prices we would expect to see the TBond futures more lower. If, on the other hand, oil prices show either less strength or greater weakness then the TBonds will spend the next quarter or so in the recent trading range.