March 16 (Bloomberg) — The president of the Tokyo Stock Exchange appealed for calm after an earthquake and nuclear accident triggered the biggest two-day decline in Japanese stocks since 1987.
It is only Wednesday but it already feels as if this has been a very long week.
It is definitely possible for equities to rise with a stronger U.S. dollar. History has shown that equities can move upwards quite easily when long-term interest rates are falling. We have seen periods of time that have included weaker copper and crude oil prices AND a strong equity market. Yet… in the here and now of the current trend it feels as if the only way the stock market can resolve higher is if the Asian growth/commodity theme represented by copper prices and the Australian dollar is on the rise. Any trend that does not push long-term yields upwards is apparently a recipe for a broad-based asset price collapse.
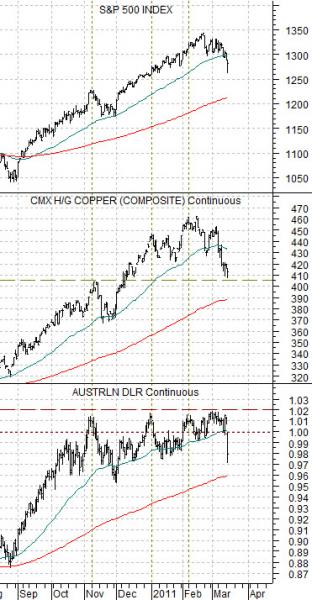
Just below we return to a chart comparison that we included on the first page of the IMRA a week or two back. The chart shows the Australian dollar (AUD) futures, copper futures, and the S&P 500 Index.
The arguments were that the SPX has been rising with the kind of cyclical growth that has pushed copper prices and the Aussie currency higher but that the AUD seems to be having trouble getting through the 1.01- 1.02 range.
Each time the AUD has approached 1.02 we have seen a peak for copper prices which, in turn, has the potential to create a sell off in the equity markets.
Our view was that one of two things had to happen. Either the Aussie dollar had to break out above 1.02 to extend the rally for copper and keep upward pressure on long-term yields or… it had to fall far enough below 1.02 so that it could stage a slow push back into resistance.
The chart shows that last December the AUD was roughly .98 with copper prices close to 4.10. After all of the quake-based devastation the AUD is now around .98 with copper prices close to 4.10. The good news is that a bit of space between the current exchange rate for the AUD and resistance has finally been created which at least opens up the potential for a quick return to the previous bullish trend.

Equity/Bond Markets
We were remiss in not returning to one of the charts that had been bothering us in recent weeks. Too late… we do so today.
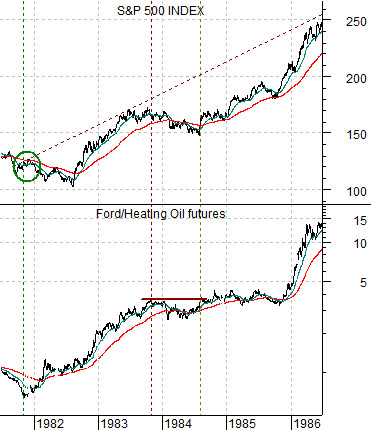
Below is a comparison between the SPX and the ratio between Ford (F) and heating oil futures from 1981 into 1986. The ongoing argument was that the F/heating oil ratio bottomed well ahead of the SPX in 1981 and defined the rising trend. In other words when the ratio bottomed and started to rise it shifted the trend to bullish even though the SPX remained under pressure into August of 1982.
The ratio reached a peak in late 1983 which led to the stock market correction into the late summer of 1984. As the ratio moved to new highs that year the stock market turned sharply positive once again.
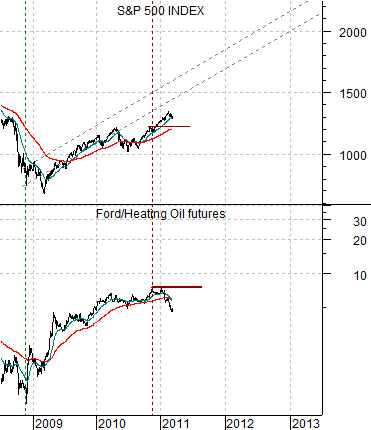
The chart below shows that the ratio bottomed in late 2008 months ahead of the low for the SPX and it reached a peak late 2010. The idea was that this was supposed to go with a stock market correction but the SPX continued to rise on energy price strength. Our sense is that an eventual push to new highs for the ratio (as Ford rises relative to crude and heating oil) will go some distance towards improving the trend for the SPX.
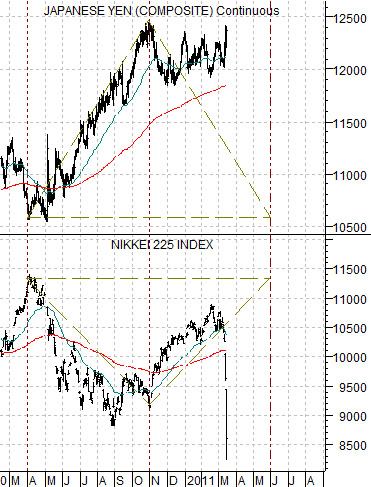
Quickly… the last chart shows the Nikkei 225 Index and the Japanese yen futures. This is actually an extension of the argument from the next page. The idea is that IF the yen does NOT break to new highs above 1.25 THEN we can make a chart-based argument for a rally back to or near 11,300 some time during the second quarter of this year. The idea is that in 1995- 96 the Nikkei moved in the opposite direction of the yen and took close to the same amount of time rising as it had spent falling (creating a nice ‘triangle’ pattern).


