Goodness… where to start? The negatives have been well documented but we did see a few glimmers of hope amidst the carnage yesterday. The bond market, for example, rallied right into resistance so if prices turn lower today that might help the equity markets. Copper prices were actually quite strong on a relative basis. Ocean freight rates (Baltic Dry Index) have been rising which is significantly different than the late summer of 2008.
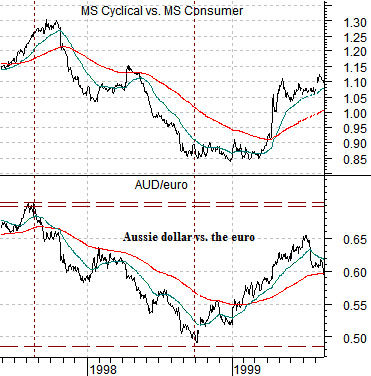
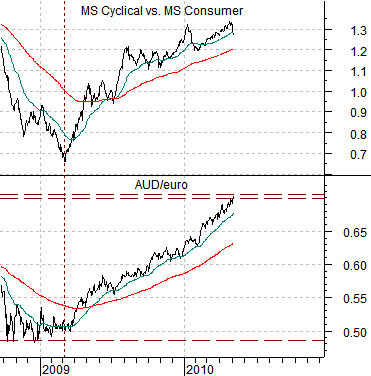
At top right we show a chart comparison between the cross rate of the Australian dollar (AUD) futures and the euro along with the ratio between the Morgan Stanley Cyclical Index and Consumer Index. The chart includes the time frame from early 1997 into late 1999. Below right is the same comparison for the present time period.
The premise is that the AUD/euro has risen with the cyclical recovery but that based upon the way it peaked just over .70 back in 1997 it may have trouble moving higher than current levels.
If the AUD/euro has reached resistance then… it should stop rising. If the AUD/euro stops rising then a case can be made that the equity markets will no longer be powered by strength in the cyclical sectors. Fair enough.
In a sense we return to the same argument that we made through 2008. It is not a given that the S&P 500 Index will decline if the cyclical/consumer ratio turns lower. That was most certainly the case in 2008 but it is also true that the consumer stocks powered the market higher from 1995 through 1998.
When the U.S. dollar turns higher the consumer stocks tend to rise relative to the cyclical stocks. The key, of course, is whether the consumer stocks actually rise in price. Between 1995 and 1998 the S&P 500 Index came very close to tripling in value because the consumer sectors were on the rise. In 2008 the entire market collapsed because the consumer stocks outperformed simply be declining at a slower pace.
The point? With the AUD/euro cross rate into resistance just above .70 (similar to 1997) and the Cyclical/Consumer ratio close to 1.30 (similar to 1997) the next stage of the cycle should feature a swing back to the large cap consumer sectors. Whether this goes with equity markets strength or weakness depends in large part on whether the valuation contractions of the past decade have gone far enough to serve as support.
May 6 (Bloomberg) — The Dow Jones Industrial Average posted its biggest intraday loss since the market crash of 1987, the euro slid to a 14-month low and yields on Greek, Spanish and Italian bonds surged on concern European leaders aren’t doing enough to stem the region’s debt crisis. U.S. Treasuries surged.
Given that we have shown the comparison between the current market and 1987 on a number of occasions recently the sight of the DJII approaching a 1000-point loss midway through the trading session was a bit unnerving. However… given the action yesterday we might as well run the comparison once again.
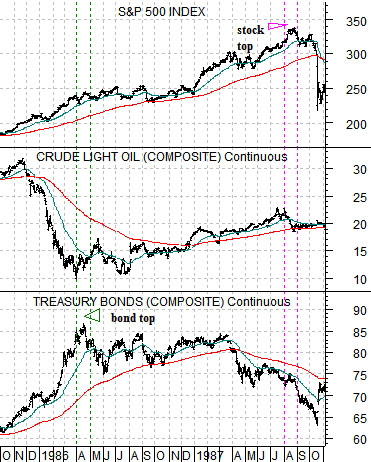
Our premise began with the way crude oil futures prices collapsed through the end of 1985 and into the spring of 1986 after several years of significant outperformance relative to the CRB Index. When crude oil futures prices declined into 1986 the offset was a sharply rising bond market.
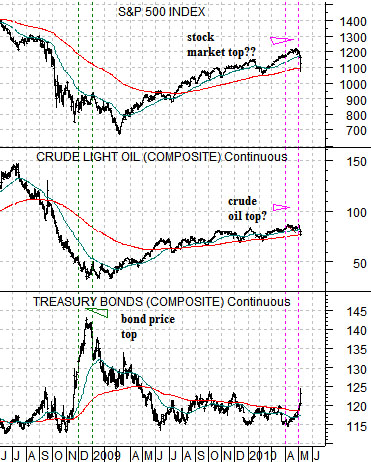
The bond price peak in April of 1986 serves as the anchor for our comparison. We have lined up a chart of the U.S. T-Bond futures, crude oil futures, and S&P 500 Index from 1985- 87 with one starting in June of 2008.
Oil price weakness sent bond prices blasting higher into 1986 and again into December of 2008. Once crude oil reached a bottom the trend reversed as energy prices rose and bond prices fell.
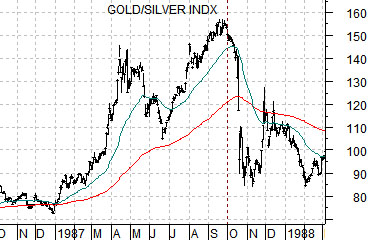
Our view was that as cyclical growth settled out in 1986 the money that had herded into the bond market began to move back towards equities and commodities. As time went by the rally became more and more speculative with much of the focus on the gold miners. The chart below shows that the Philadelphia Gold and Silver Index (XAU) continued to rise through the equity market’s peak in August of 1987 and right into the start of the crash in early October.
Similarities: Collapsing oil prices and an offsetting bond price rally. A return to cyclical strength once oil prices bottomed and bond prices topped. A literal interpretation from the bond price peak in April of 1986 to the stock market’s top in August of 1987 marked April of this year as the potential top for equities and commodities.
Differences: Instead of breaking to new lows as was the case in 1987 the bond market held the lows and reversed back to the upside.