Nov. 2 (Bloomberg) — Ford Motor Co., the only major U.S. automaker to avoid bankruptcy, posted third-quarter net income of $997 million and its first operating profit since early 2008 on smaller discounts and higher sales.
We have probably made this point a dozen or more times over the past couple of years but, since it is important, we will take another run at it.
The argument is that the trend that originated back in 1994- 1995 when interest rates peaked and the U.S. dollar began to rise was focused primarily on large cap U.S. equities with a specific emphasis on the non-commodity sectors. In other words it was a very positive time frame for the major banks as well as names such as Microsoft, Coca Cola, Merck, and Home Depot.
As the trend matured it started to narrow- as most trends tend to do. The stronger dollar indicated that money was moving away from the Asian, Latin, and emerging markets themes. By the start of 1997 crude oil prices began to decline which helped create a very positive trend for the ‘energy using’ cyclicals. As a result the share price of Ford accelerated to the upside.
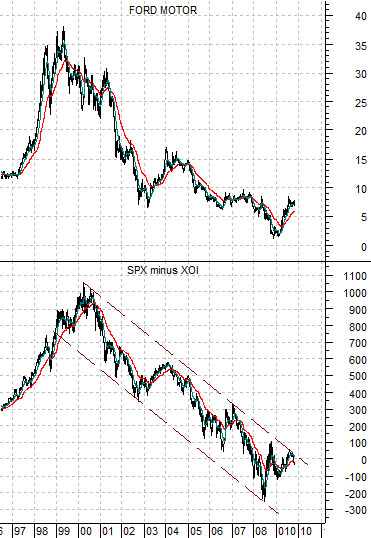
The chart below compares Ford (F) with the spread or difference between the S&P 500 Index (SPX) and the Amex Oil Index (XOI). The point is that when the broad market is rising relative to the large cap oil producers… the general trend will tend to be positive for most of the non-commodity sectors- including the autos.
After running in one direction for a considerable length of time the trend reached a peak between 1999 and 2000. By then the trend had narrowed yet again so that the focus was almost entirely on the tech and internet sectors so a full year before the broad market reached its high the share price of Ford turned back to the down side.
With the consumer growth and tech sectors now trading at extreme valuation levels money began to exit the dollar. The path of least resistance led towards the commodity sectors which helped define the trend between 2000 and 2008.
The point that we are trying to make today has to do with energy prices and the autos. The offset to energy price strength is a declining trend for the auto makers. Fair enough. Many believe that stronger energy prices will remain with us for years to come and that we will see new highs for crude oil within the next few quarters. Many believe that the SPX minus XOI spread will continue to decline even though the XOI has gained a full 1000 points on the SPX over the past decade. The prob lem with this view is its ramfications for the autos and the circling ramification for energy prices.
If the post-2000 trend favored the energy sector and punished the autos to the point where both GM and Chrysler tipped into bankruptcy… what will happen if the trend does not change? If the SPX minus XOI spread continues to decline for years to come… the auto industry might end up disappearing. But… to the extent that autos represent energy usage the greater the stress on the autos the lower the ultimate demand for energy which, from our perspective, should lead into a new trend that will swing the SPX minus XOI spread back to the upside.

We have quite a number of fixations on the go at present; one of them has to do with the ratio of the share price of Coca Cola (KO) to the S&P 500 Index (SPX).
Above we showed a longer-term view of the share price of Ford noting that it had been falling since the end of the 1990’s. The same is basically true for large cap names such as Wal Mart and Coke. The difference is that these stocks have been flat as earnings and dividends have risen while the autos were simply flat-out negative. The point is that a swing higher for Ford should go with a break to new highs for the large cap consumer growth names. That, at least, is the premise.
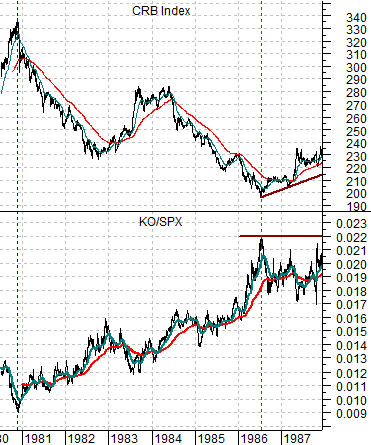
Below we compare the CRB Index to the KO/SPX rato from 1980 through 1987. The argument would be that as long as the KO/SPX ratio is trending higher the corresponding trend for the CRB Index should be lower.
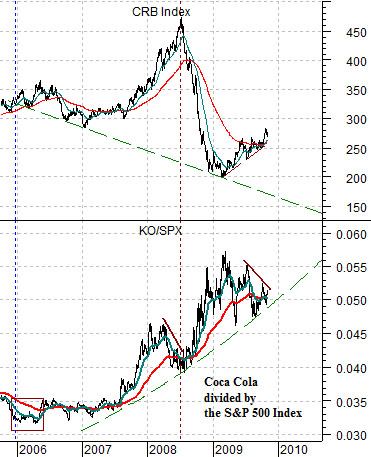
Below we show the same comparison for the current time period. The chart detail that we are focusing on is the similarity between now and mid-2008. In other words… with the KO/SPX ratio still either in a rising trend or, at minimum, not clearly tipping into a declining trend the possibility exists that we are approaching a second top for the commodity markets. Obviously a ‘second top’ will require a ‘second bottom’ for the U.S. dollar.
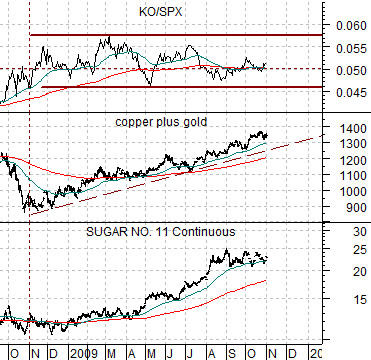
Below we compare the KO/SPX ratio with sugar futures and the sum of copper futures (in cents) and gold futures (in dollars).
If the KO/SPX is rising… commodity prices are likely negative. If the ratio is falling… commodity prices should be positive. From the autumn of last year as sugar, copper, and gold futures prices have risen… the ratio has simply held flat very close to .05. In other words Coke’s share prices has tended to swing back and forth around 5% of the value of the S&P 500 Index. A push above the upper channel line argues for a weaker commodity price trend while a break below the channel bottom suggests stronger raw materials prices going forward. An ongoing flat trend suggests that the markets are working into a decision point with the conclusion yet to be revealed.


