After watching commodity prices rise to a bubble peak at the start of the 1980’s, Japanese asset prices to incredible levels into 1990, and then the Nasdaq into yet another bubble in 2000 we came up with the notion that the markets were doing the same things over and over again using different sectors each decade. This particular view is called the ‘decade theme’.
In broad terms the markets have been making bubble tops in the first (0) year of a decade, cyclical bottoms in the second half of the second (2) year, consolidations during the fourth year (4), with crashes and crises in the seventh and eighth years (7, 8). Rinse and repeat.
The challenge is that the cast of characters keeps changing from decade to decade. For example, if we had asked almost anyone ten years ago what it would mean if gold prices went ballistic the answer would have been something like a return to hyperinflation. Stronger gold prices have long been associated with inflation because… gold prices, inflation, and interest rates rose in tandem through the 1970’s.
The argument is that we are now entering into the second half of the second year of a new decade. Within the next few months if the pattern persists the markets should be ready to conclude a bear market in a number of cyclical sectors. But… after all of the drama in 2008 followed by the sharp recovery and strength in 2009… which cyclical market or sector is at what might very well be a ‘generational low’?
Our thought is that we might be looking at a significant turning point for long-term yields. After 30 years of downward pressure on producer prices is it time for a change?
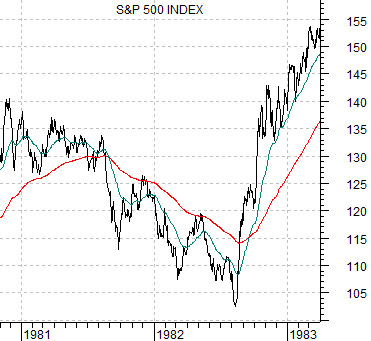
At top right is a chart of the S&P 500 Index from 1980- 83. The bear market bottom for equities was reached in August of 1982 after this index broke what was viewed as key support. Once new lows were reached the stock market pivoted powerfully to the upside.
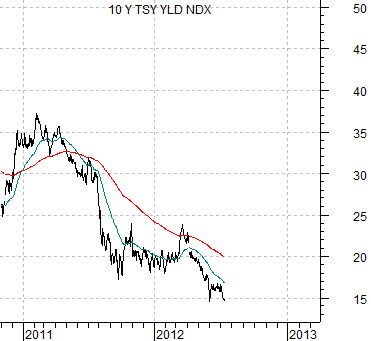
Below is a chart of 10-year U.S. Treasury yields from late 2010 to the present day. This chart has been set up to suggest at least the possibility that ‘yields’ in 2012 are in a similar technical position to ‘equities’ in 1982. It would be interesting if 10-year yields rose rapidly to the 200-day e.m.a. line (roughly 2%) and then just kept on going.
Equity/Bond Markets
Above we attempted to show a comparison between long-term Treasury yields in 2012 and large cap U.S. equities in 1982. The argument was that cyclical bottoms tend to be made in the second half of the ‘2’ year so we are approaching the time and the place for some kind of major trend change.
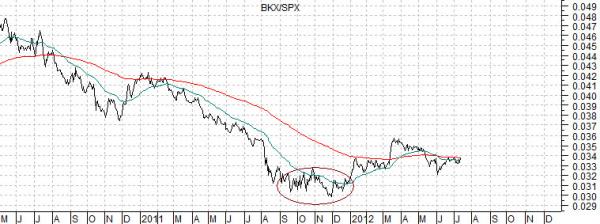
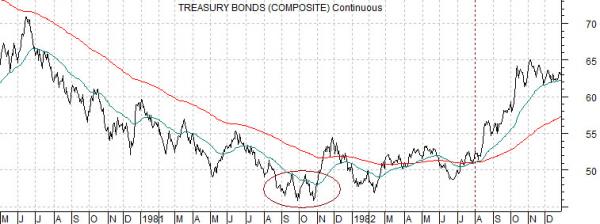
Below is a chart of the U.S. 30-year T-Bond futures from 1980- 82 along with a chart of the ratio between the Bank Index (BKX) and S&P 500 Index (SPX) from the current time frame.
The idea here is that the upward pivot for the S&P 500 Index in August of 1982 was a lagged response to the bond market bottoming out in the final quarter of 1981.
The TBond futures hit a cycle low in October and November of 1981 and then flat lined around the moving average lines until the following August. In this instance the equity markets lagged the bond market as the trend shifted from inflation towards disinflation.
The ratio between the Bank Index and the S&P 500 Index reached bottom in the final quarter of 2011 and, in similar fashion, has been chopping back and forth through the moving average lines for much of this year. Our thought is that much of the downward pressure on interest rates since 2007 has come from the impact that declining asset prices have had on the banking sector.
If the stock market ‘leads’ the news then what will it mean if the BKX/SPX ratio starts to rise from current levels? We would suggest that the most likely interpretation would be that the combination of the passage of time along with gains in U.S. employment and income are creating upward pressure on housing prices.
The decade theme suggests that one or more cyclical markets should bottom and turn higher during the second half of this year. The charts suggest that in 1982 the stock market made a major bottom months after the bond market began its recovery.
In the current situation yields have declined in response to a series of crises that have been hitting the markets all too frequently since 2007- 08. The financial stocks led to the down side so it makes some sense to assume that a rising trend for interest rates will follow strength in the banking stocks. The BKX/SPX ratio made a bottom in the last quarter of 2011 so a return to strength in the third or fourth quarter of this year may be enough to cause long-term interest rates to turn rather rapidly higher.