Below is a chart comparison that includes two opposing trends. In attempting to sort the relationships out even our eyes glazed over somewhat but we believe that this will be worth the effort. At least we hope so.
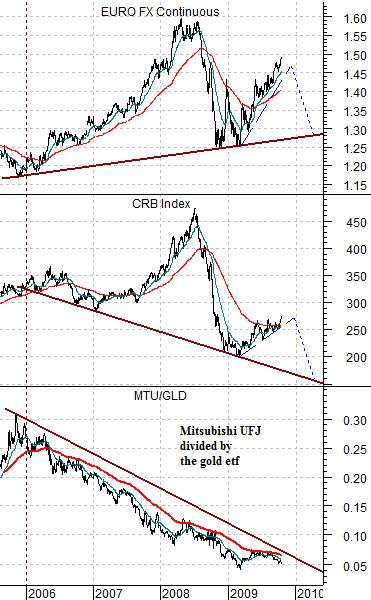
The first trend is shown through the ratio of Japanese bank Mitsubishi UFJ (MTU) divided by the gold etf (GLD). We have argued in the past that bank share price relative strength is a function of the cyclical trend. In other words when the cyclical trend is dominated by rising commodity prices then the banks from commodity producing countries will outperform those of commodity user countries. Canadian banks will do better than U.S. banks which will do better than Japanese banks.
The MTU/GLD ratio depicts a negative trend for the banking sector and a positive trend for gold prices. The trend began around the end of 2005.
The chart also includes the euro and the CRB Index. The CRB Index trends with the MTU/GLD ratio so as long as this ratio is lower the trend for the CRB Index is lower as well.
The problem is that commodity prices also tend to rise with the euro or, put another way, tend to rise when the U.S. dollar declines. So on the one hand we have the MTU/GLD ratio pulling commodity prices lower while on the other the rising trend for the euro is pushing them higher.
We argued years ago that the CRB Index should turn lower in the spring of 2006. To an extent we were correct as long as one ignores the huge rise in commodity prices into 2008. The trend for commodity prices swung negative in early 2006 as the banks began to weaken relative to gold prices but the weaker dollar pushed the CRB Index so far above ‘trend’ into 2008 that it took a complete markets massacre complete with a series of banking system failures to pull the CRB Index back to the declining trend line.
The point? We had hoped that gold prices would decline this year in response to rising bank share prices. We had hoped that the MTU/CRB ratio would swing higher ‘naturally’ as money determined that the need to hold gold as a store of value had passed. Our concern is that the MTU/CRB ratio continues to decline because if that proves to be the case the argument would be that the almost inevitable outcome will be a replay- albeit on a somewhat smaller scale- of last year. The trigger- as was the case in 2008- was dollar strength which would have the potential to pull the CRB Index back to new lows as the euro declines below the 1.30 level.
Equity/Bond Markets
The argument above was that one of the key ‘drivers’ behind the pressure on cyclical asset prices is still moving lower and to the extent that the trend for the MTU/GLD ratio defines the base trend for commodity prices… the risk of another dropped shoe remains.
On the other side of the coin the weaker dollar is elevating commodity prices and creating the impression of cyclical vitality. How much of the rise in commodity prices is due to dollar weakness is open to question but we only have to look back to last year to see what can happen once the dollar turns upwards.
The first piece of good news that comes to mind is that- to date- the distance down to the support line for the CRB Index is considerably smaller than it was in 2008. Even so a return ‘on trend’ would be painful because it would likely go with new lows for both crude oil and copper futures prices.
A second positive spin on the argument’s outcome would be that instead of falling commodity prices we end up with rising financial asset prices. In particular… a recovery that gathers enough steam and engenders enough confidence to push the bank shares higher in the face of weaker gold prices.
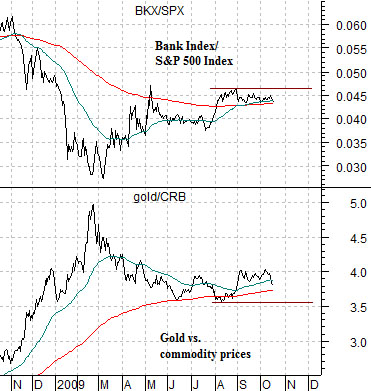
Below is a comparison between the ratio of the Bank Index (BKX) to the S&P 500 Index (SPX) and the ratio between gold prices and the CRB Index.
The gold/CRB Index traded generally between 1.2:1 and 2.1:1 from 1980 into 2007. In other words a fairly ‘normal’ level for gold prices given the current position of the CRB Index would be something closer to 550 instead of Friday’s close near 1050.
We have argued that the offset to ‘very strong gold prices’ is ‘very weak banking share prices’. The gold/CRB Index ratio will decline, we suspect, in response to a rise in the BKX/SPX ratio.
The point is that on any given day the markets may respond positively to news from JPMorgan Chase or negatively to Bank America but the bigger issue is how the BKX/SPX ratio responds. If it pushes to new highs then gold prices should decline relative to commodity prices. If it swings back towards the lows… then the gold game is still on.
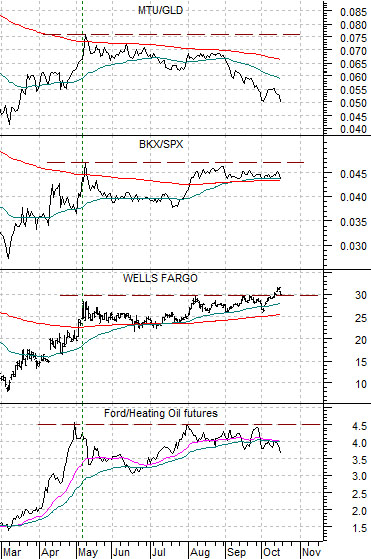
At bottom is a comparison between the Ford/heating oil futures ratio (energy users/energy prices), Wells Fargo (WFC), the BKX/SPX ratio once again, and the MTU/GLD ratio.
This week’s surge in energy prices didn’t do the markets any favors even though strength in the share prices of the energy producers helped lift the stock market indices. We have argued that a bullish outcome requires new highs for the Ford/heating oil ratio which should go with strength in the BKX/SPX ratio and- hopefully- an end to the daily declines that we have seen of late in the MTU/GLD ratio.
The idea is that the markets can most certainly drive energy and metals prices higher feeling justified in some way because the economy is improving and China, of course, is still growing. From an intermarket point of view this may create short-term profits for those willing to trade momentum but we have been down this road before and we know where it leads.