We argued through late 2003 that the Fed was holding the funds rate too low and that eventually the markets would make them push short-term rates higher. In the first quarter of 2004 we began to argue that the driver behind upward pressure on short-term yields would be stronger energy prices and in March of that year we made the crazed prediction that crude oil prices could rise as high as 75. Obviously our forecast was far too low but at the time with crude oil trading closer to 35 our target felt more than a little aggressive.
In the spring of 2004 crude oil futures prices broke to new highs and the rest is history. 3-month TBill yields began to rise and by mid-year the Fed increased the funds rate.
Many believe that the combination of inflation, employment, and the output gap will keep the funds rate at current levels into 2011 or even 2012. Our rather simplistic view is that the Fed will keep the funds rate between 0% and .25% just as long as the markets tell them that this is an appropriate range.
We will know when a policy change is imminent when 3-month TBill yields rise above .25% which, obviously enough, has not happened as of yet.
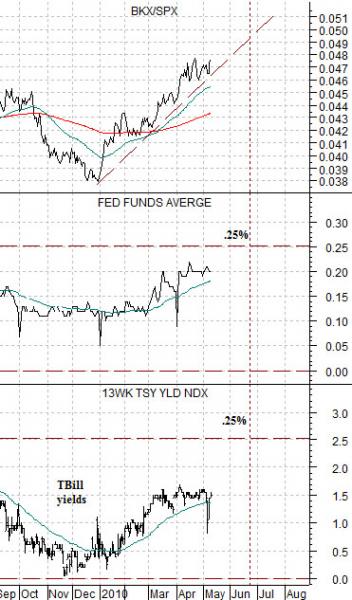
Below is a chart comparison between 13-week (3-month) TBill yields, the Fed funds target rate, and the ratio between the Bank Index (BKX) and S&P 500 Index (SPX).
When the dollar began to rise towards the end of 2009 the markets began to trend in a slightly different direction. In other words concurrent with dollar strength the chart shows that TBill yields began to drift up from 0% as the banks began to outperform the broad market.
One of our recurring themes over the past few months has centered around the idea that while energy prices drove short-term yields higher back in 2004 the relationship between the BKX/SPX ratio and TBill yields suggests at least the possibility that a relentless price recovery for the major financials will lead to TBill yields moving above .25% followed a month or so later by a hike in the funds rate.
The risk in narrowing our focus this tightly is that upward pressure from rates is coming from some other direction. For the time being, however, we will continue to keep an eye on the relationship between the BKX/SPX ratio and TBill yields.
Equity/Bond Markets
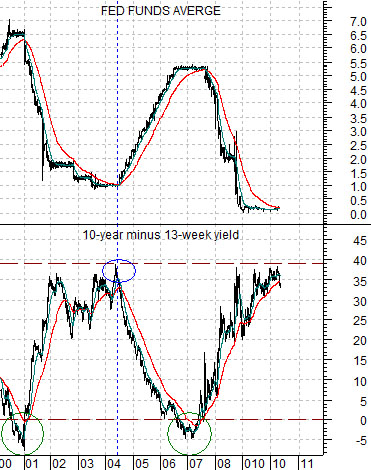
Below we show the Fed funds target rate and the yield spread between 10-year and 3-month Treasuries.
The yield spread went negative into the end of 2000. 3 1/2 years later the Fed began to raise the funds rate… about a month AFTER the yield spread began to trend lower.
It is now roughly 3 1/2 years since the yield spread went negative in late 2006. While it might seem hard to believe that a funds rate increase is due later next month… the sharp decline in the yield spread over the last month or so is very similar to the time period leading up to the funds rate hike in 2004.
A second point would be that an inverted or negative yield spread will tend to kill cyclical growth. That was the case in 2000 at the top for the Nasdaq and again into 2007 as the banks began to crumble. The difference between now and then is that the yield spread is massively accommodative today so if one can borrow short-term and lend long-term- which is what banks do- this is a profitable economic back drop.
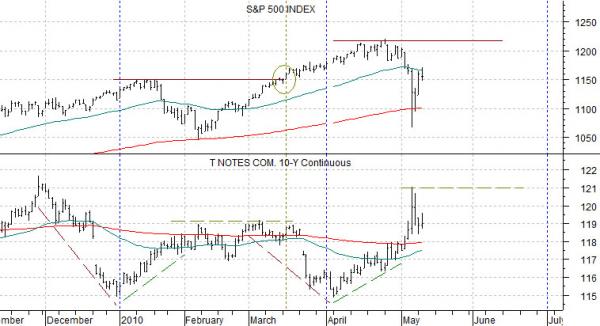
Below is a chart comparison between the SPX and the U.S. 10-year T-Note futures.
If the recent trend repeats then the equity markets should bottom at the peak for bond prices. So far, so good. Bond prices held roughly flat from February into March as the SPX slowly worked back up to the January highs. The arguments are that as long as the T-Note futures are not making new highs the equity markets should remain generally positive and if, as, or when the SPX pushes back up through the April highs the bond market should turn lower. If history were to repeat exactly the bond market would reach its next price bottom around the end of the current quarter.