After virtually ignoring the markets for the past two weeks only to return to yet another chaotic session it makes some sense to stick with macro thoughts and themes for a day or so.
The template that we have been working with is based on the way the markets have started the last number of decades. There has been a cyclical peak in the ‘0’ year, a point of maximum stress late in the ‘1’ year, and a cyclical bottom in the autumn of the ‘2’ year. If the pattern persists then we are in the vicinity of the point of maximum stress and, perhaps, a year out from the next true cyclical bottom.
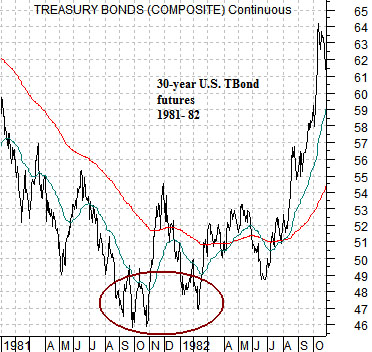
Commodity prices peaked in 1980. The long end of the bond market bottomed in late 1981. The stock and commodity markets reached lows later in 1982. In other words the cyclical peak was reached in 1980, the point of maximum stress (creating the start of a recovery) was made in late 1981, while the cyclical low was created later in 1982.
The chart below shows the U.S. 30-year T-Bond futures from 1981 into 1982. The low point for bond prices (signifying the top for long-term yields) was made into the final quarter of 1981. While cyclical asset prices remained under pressure for the next year the actual recovery began with the rise in bond prices.
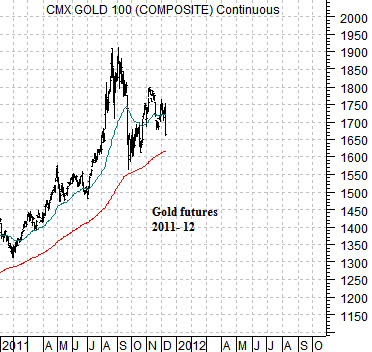
Below is a chart of gold futures. For good or for bad our view has been that gold represents ‘stress’ on the banking system and financial markets. If we are correct then the point of maximum stress this time around will line up with the peak for gold prices with downward pressure on gold lining up with the leading edge of a recovery that may take well into 2012 before broad traction becomes evident.
Our point, we suppose, is that a sustainable recovery will begin with gold price weakness. Between the start of the recovery and the kind of broad-based rise in asset prices that causes investors to take true notice a few things still have to happen. In particular… energy prices have to decline. Significantly.
In summary, we expect to see lower gold prices and the kind of dollar strength that puts downward pressure on energy prices. We continue to look for a decline in the gold/CRB Index ratio (page 4) while expecting that commodity prices will remain under almost relentless pressure into the second half of 2012.
We were tempted to keep the same charts for this issue that we used in our final issue in late November. Instead we have changed a number of the charts while keeping the two from this page.
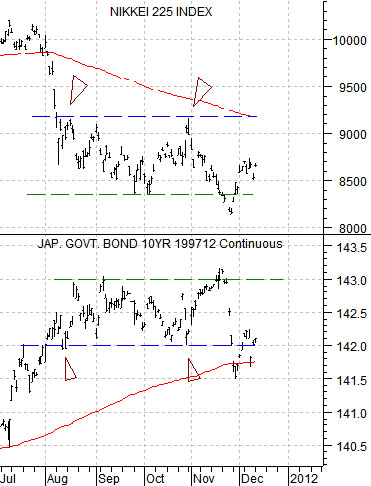
Below is a comparison between the Nikkei 225 Index and the Japanese 10-year (JGB) bond futures.
The idea was that the Nikkei would bottom when the JGBs peaked and that the point of ‘maximum stress’ would be reached this quarter. In other words… if Japan represents the kind of market that should slowly lead to the upside while falling commodity prices apply pressure to other markets for the next year then the trend shift should be marked by a peak in the Japanese bond futures.
The chart shows that- so far- the JGBs reached a price top in November that went with the Nikkei falling below 8500. If we have this right then there will be good days and bad days in the markets but if one looks back a few months or quarters from the now the peak for the Japanese bond market will have been reached in November of 2011.
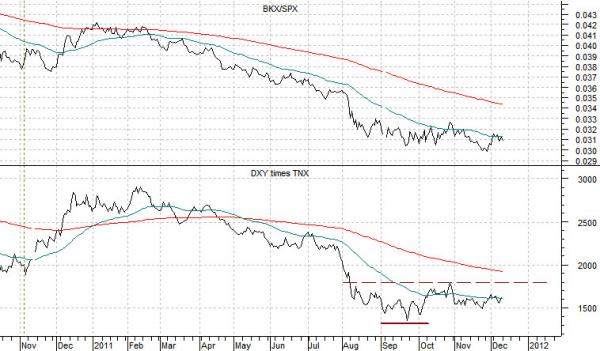
Before we left we introduced the idea that the ‘key’ for the recovery might include both a stronger dollar AND rising yields. To show this we put together a comparison between the combination of the U.S. Dollar Index (DXY) and 10-year Treasury yield index (TNX) against the ratio of the Bank Index (BKX) and S&P 500 Index (SPX).
Our presumption is that a rising BKX/SPX ratio is ‘good’. A trend based on banking system weakness makes little sense in the long run. We have argued that the BKX/SPX ratio is also the mirror image of the gold/CRB Index ratio. We would like to see the DXY times TNX bottom this year to mark the point of maximum stress and then resolve higher into 2012 as a stronger dollar contains raw materials prices.