One of our recurring themes over the past while has been that gold prices appear to be tracking in manner similar to the equity markets in front of the crash in 1987.
Below is a chart of the S&P 500 Index (SPX) from late 1986 into September of 1987. The stock market ‘crash’ began in early October with the SPX erasing- quickly- a full year’s worth of gains.
Below we feature a comparison between gold futures and the ratio between the Bank Index (BKX) and the SPX.
The basic argument has been that gold tends to rise when the dollar is weaker so when the dollar turns upwards the ‘driver’ behind higher gold prices disappears. We have also shown that gold has been trending inversely to the relative strength for the major U.S. banks with tumbling financial share values leading directly to increased interest in gold as a safe haven.
With gold futures prices rising back above 1200 last week in the face of a stronger dollar and an upward trend in the BKX/SPX ratio the conclusion is that either our intermarket arguments are completely wrong or… gold’s divergence is merely a prelude to an impending correction.
We have set the charts up at right to make a specific point. Ongoing strength in the BKX/SPX ratio should be pulling gold prices back towards the 900’s. To the extent that gold prices are still rising then an argument can be made that the chart is similar to that of the SPX from 1987.
The correction for gold prices between December and early February lines up with the correction for the SPX between March and May 1987. The extension of the equity market’s rally in 1987 to the August peak suggests that gold prices could be making a price top into May that will eventually lead to a correction back below 1000 towards the end of the quarter.
The intriguing question- to us- is that if gold prices were to decline by a reasonably significant amount… why would this happen? If a stronger dollar and a recovery in the share prices of the banks weren’t enough to slow the ascent of gold what other factor would have to come into play? Our thought is that it would likely have to include some kind of resolution or the perception of a resolution in Europe’s sovereign debt problems.


Equity/Bond Markets
May 9 (Bloomberg) — Standard & Poor’s 500 Index futures advanced on speculation an emergency loan fund to bail out debt- laden European countries will keep the region’s credit crisis from spreading.
Below is a chart of the cross rate between the Aussie dollar (AUD) and euro. The recent argument has been that the cross rate peaked just above .70 back in 1997 so this level may serve as major resistance.
The AUD/euro has risen relentlessly since the end of 2008. We suspect that there is considerable short-term risk in being short the euro and long the commodity currencies at this juncture.
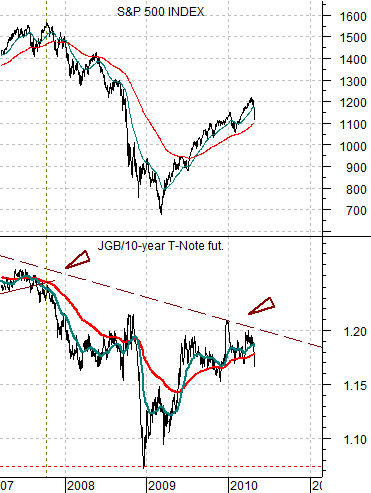
Further below we compare the SPX with the ratio between 10-year Japanese and 10-year U.S. bond futures.
When the U.S. bond market starts to jump- as it has been doing since early April- and the JGB/T-Note ratio starts to weaken we can’t help but recall that each time this ratio has fallen since 2000 the stock market has declined. That was most certainly the case last week. To get back to a better equity markets trend we will need to see the return of pressure on long-term bond prices.
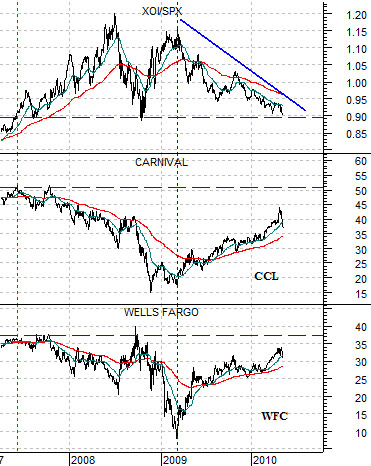
At bottom is a comparison between the share prices of Wells Fargo (WFC) and Carnival (CCL) and the ratio between the Amex Oil Index (XOI) and SPX.
We have been arguing for some time that when the XOI/SPX ratio turns lower it should lead into a recovery for both WFC and CCL. One problem that we had with the recent stock market decline is that we have yet to see any kind of strength in the oils. In other words the XOI/SPX ratio has continued to work lower.
Our view has been that as long as the XOI/SPX ratio was in a negative trend then the financials (WFC) and consumer cyclicals (CCL) should still be in rising trends. While prices corrected lower over the past week or so we still believe that underlying trend is positive.


