With the monthly U.S. employment report now in the rear view mirror the next hurdle comes from the raft of quarterly earnings reports that begins with Alcoa after the close of trading today. As usual the key isn’t the actual numbers but the way the markets react to the numbers as we get a reading on whether expectations are overly bullish or bearish.
If we tried hard enough we could probably figure out a way to set up a variety of chart comparisons to support virtually any kind of outcome. When one has a bias- especially a long-standing one- it is all too easy to lose touch with reality and at times we wonder whether that is the case with gold these days. Time will tell…
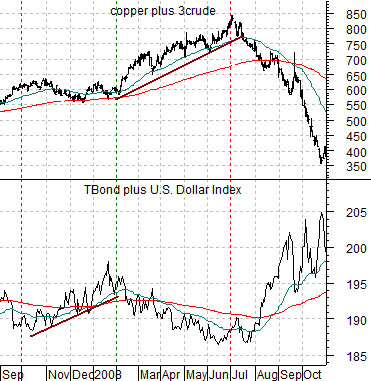
Just below is a comparison between the sum of copper and crude oil and the sum of the U.S. 30-year T-Bond futures and U.S. Dollar Index (DXY) from 2007- 08.
The argument is that copper and crude oil rise when the dollar and bond market decline. In other words the most positive intermarket back drop for base metal and energy prices is a weaker dollar (supporting commodity prices) and falling bond prices (supporting stronger cyclical growth).
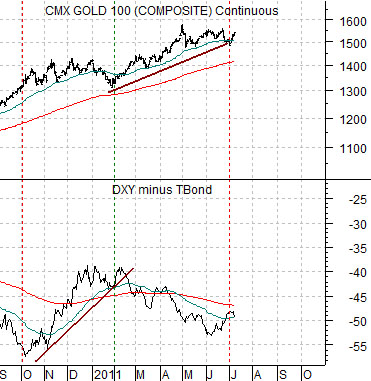
Next is a comparative view of gold futures and the spread or difference between the U.S. Dollar Index and U.S. 30-year T-Bond futures.
Similar to copper and crude oil the price of gold benefits from a weaker dollar. The difference is that gold does better with rising bond prices (supporting slower growth and greater economic uncertainty) while copper and crude oil rise with falling bond prices.
The point is that copper and crude oil trend with the sum of the TBond and dollar while gold trends with the spread between the dollar and TBond.
The next point is that the spread between the DXY and TBond looks very similar (amazingly similar) to the sum of the TBond and DXY through the end of 2007 and into July of 2008. If the markets were to resolve later this month towards a stronger and dollar and declining bond prices then a case can, in theory, be made for a fairly major decline in gold prices through the second half of this year.
Equity/Bond Markets
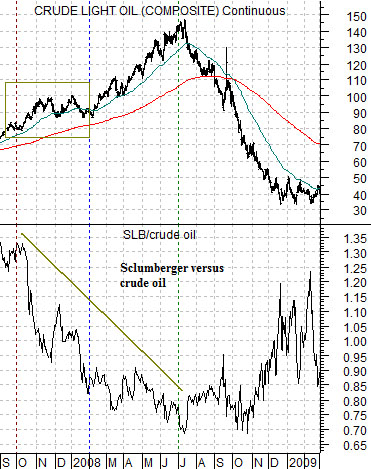
Below is our chart of oil service company Schlumberger (SLB) and the ratio between SLB and crude oil futures prices from 2007 into early 2009.
The argument was that over the last nine months of the upward drive for oil prices into July of 2008 the price of oil rose at a faster pace than the equities that tend to be highly correlated to oil prices. In other words… the oil stocks (Schlumberger) failed to keep pace with the pace of oil price gains. This caused the SLB/crude oil ratio to trend to the down side.
We have argued that the equity markets ‘lead’ so a healthy and positive trend should include a flat to rising ratio between SLB and crude oil. The point would then be that the markets figured out in the autumn of 2007 that there was nothing healthy or positive about the drive from 80 up to 147 for crude oil futures.
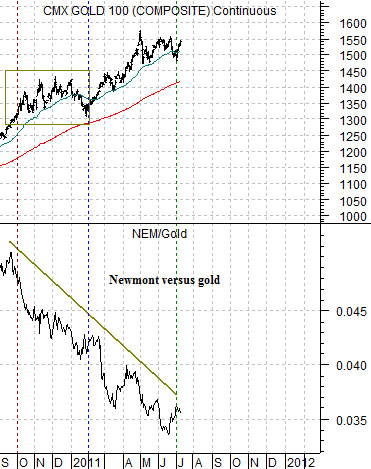
Lastly we feature gold futures and the ratio between gold producer Newmont (NEM) and gold futures.
When we compare the gold stocks versus gold from the current time frame to the oil stocks versus oil into 2008 we end up with a remarkably similar picture. Our thought is that the rise in gold prices from 1250 up to 1550 is viewed perhaps as a temporary or crisis-related issue by the markets.
So… what if gold prices were to break lower during the second half of this year? Would this be bullish or bearish for the equity markets?
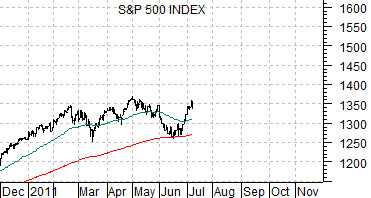
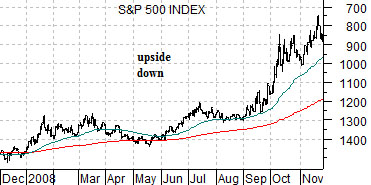
Our sense is that it would be bullish. Below we feature a chart of the S&P 500 Index from 2011 along with an upside-down chart of the SPX from 2008. The point that we are attempting to make is that in 2008 the SPX was trading below its 200-day e.m.a. line with periodic corrections up to this line while in 2011 the trend remains positive with corrections back to the moving average lines. If gold were to follow the path of crude oil from 2008 then the SPX might very well take a run at the 1500- 1550 level by the end of this year.