In yesterday’s issue we sketched out an argument that suggested that the ratio between Johnson and Johnson and the price of the 30-year U.S. T-Bond futures should rise through the first quarter of 2013. The twist, of course, is that this is a ratio so we could either get a flat bond market and a rising JNJ share price or a weak bond market and a flat to lower price for JNJ.
One issue that we are currently struggling with involves the prospect of almost anything of importance taking place during the summer doldrums. We suspect that traders have drifted off to where ever they go to escape the ‘dog days’ secure in the knowledge that nothing is going to change until after the Labor Day weekend. Yet… on August 12th, 1982 the S&P 500 Index closed at 102.4. On the final day of August that year the index finished at 117.6 for a gain of close to 15%. A major trend change may not be likely but it is most certainly within the realm of the possible.
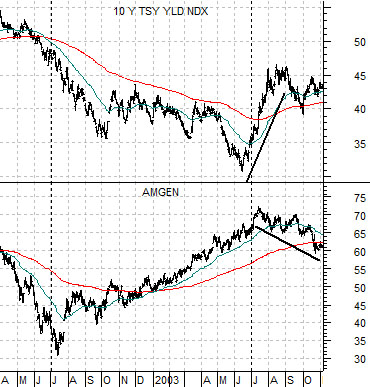
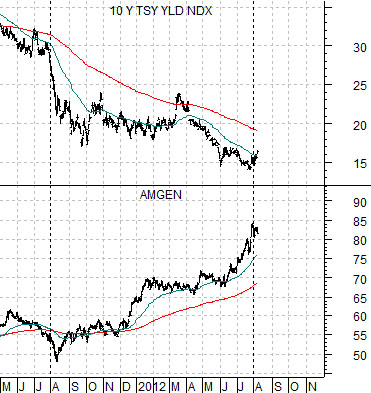
Below is a chart of Amgen (AMGN) along with 10-year Treasury yields from 2002- 03.
Amgen has shown a tendency to lead the cyclical trend. In other words the stock price turned higher in July of 2002 ahead of the bottom for the S&P 500 Index and almost a full year in front of the low point for long-term yields in mid-2003.
Notice that just after yields began to gallop higher the share price of AMGN peaked and started to move a bit lower. Money that had moved into AMGN in search of ‘non-cyclical growth’ started to head for the exits during the summer of 2003.
Let’s take a look at the current situation because it is actually quite similar. The share price of AMGN began to ramp upwards in August of 2011 even as 10-year Treasury yields started to tumble.
So… is it possible for the trend to change in August? Is the small ‘bump’ upwards in 10-year yields yet another bear market rally or is this an indication that the markets are searching for the kind of initial traction that goes with cyclical recoveries? If we use 2003 as our guide then there is a possibility that the biotech run will draw to a close once 10-year Treasury yields punch north through the 200-day e.m.a. line (i.e. around 1.90%).
Can we compare Wells Fargo to grains prices? Not easily but it can be done.
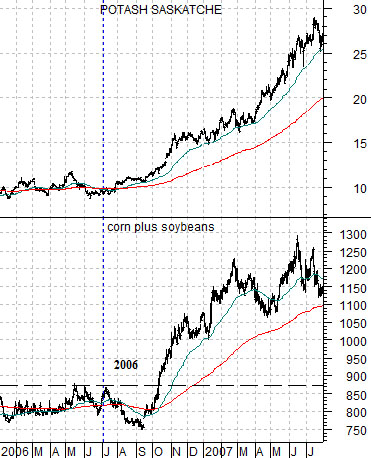
Our grains argument is that prices peak in June or July in response to the weather being too hot, cold, dry, or wet. Eventually it warms, cools, rains, or stops raining and grains prices move lower. If the crop is truly damaged then corn and soybean futures prices will move above the mid-year highs later in the autumn. Such was the case in 2006 (chart below) with the bull market rally extending into the summer of 2007 (and then extending a second time into the summer of 2008).
The ag-related stocks (we use Agrium and Potash in our comparisons) will tend to rise with grains prices so we tend to look for ‘new highs’ for corn and soybeans in the autumn as a trigger to go positive on the ag-related sectors.
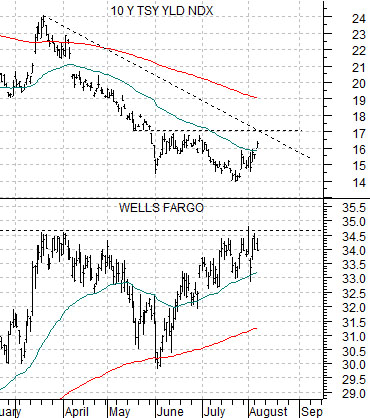
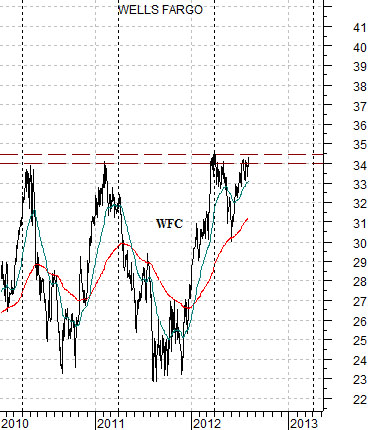
Wells Fargo (WFC) has made a price peak around 34- 35 at the end of the first quarters of 2010, 2011, and 2012. The cycle has included strength through the fourth and first quarters of the year followed by weakness during the second and third quarters.
So… what if WFC moves above resistance in August or September? Our thought is that it means upward pressure on 10-year yields (chart below) as well as a trend that might look somewhat like corn and soybeans futures prices. In other words the trend could remain bullish through into April of next year but instead of being a 23- 24 up to 34 rally it might involve something more like 34- 44 or, perhaps, a move back into the long-term rising trading channel that would move the stock into the 50- 55 range.
Of course with WFC still below resistance all of this is still in the realm of the hypothetical.