Today we have included two charts of the U.S. Dollar Index (DXY) futures along with an annual percentage Rate of Change indicator. The major bottoms for the dollar in 1992 and 1995 coincided with 15% year-over-year declines while last year’s dollar lows were made very close to minus 15%. The point? In October of 2008 the DXY rose from just over 80 up to around 88. The dollar will likely have reached the kind of year-over-year percentage declines that have marked serious dollar bottoms within the next few weeks.
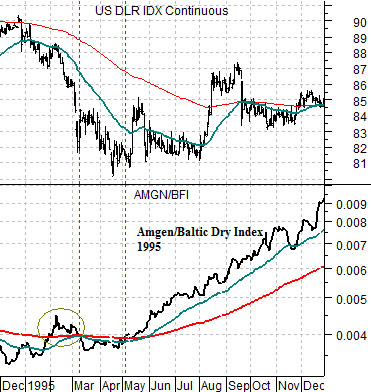
Below we show the U.S. Dollar Index futures along with the ratio between biotech giant Amgen (AMGN) and the Baltic Dry Index (BFI) from 1995- 95. The BFI is an index of ocean freight rates for dry bulk cargo.
We have argued that dollar bottoms tend to be made once the AMGN/BFI ratio swings up through its 200-day moving average line. The problem is that it not only has to rise above this moving average line but also continue to push upwards. In February of 1995 the ratio crossed the moving average line only to fail back below it once again as the dollar continued to fall. By early May the ratio was once again on the north side of the moving average lines marking a low point for the dollar that would not be approached for close to a decade.
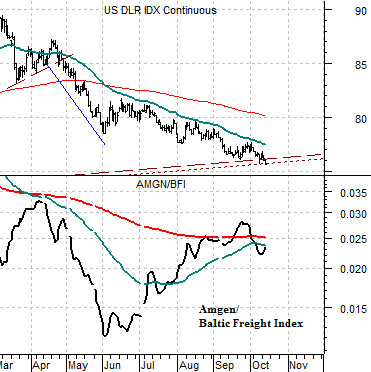
Below we feature the same comparison for the present time period. Notice that the ratio moved up to the moving average lines in April only to buckle lower. A second foray occurred into September as the ratio successfully crossed above the moving average lines before declining once again.
The obvious point is that the ratio has yet to clearly break to the upside while the dollar has also failed to find a bottom. For this argument to gain a bit of traction we will likely have to see continued weakness in ocean freight rates and… some inspired strength in the biotech sector.
The key back in 1995, by the way, was an upside break out by Amgen after a 2-year period of correction. While the break out occurred in June- a couple of months after the ratio marked a dollar bottom- a similar occurrence this year would likely require AMGN to get on the high side of at least 65.
Equity/Bond Markets
So… why the fixation on the dollar? One very good reason would be that the equity markets are and have been rising as the dollar has declined so even the hint of a dollar bottom casts some short-term doubt on the equity markets’ continued good fortune.
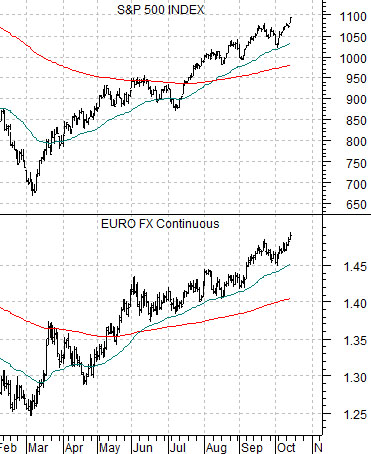
Below is a chart comparison of the S&P 500 Index (SPX) and euro futures. We have made this point in the past but it likely bears repeating. The SPX has been tracking higher along with the euro. If the euro is making new daily highs relative to the dollar then chances are fairly good that the SPX is going to close ‘green’.
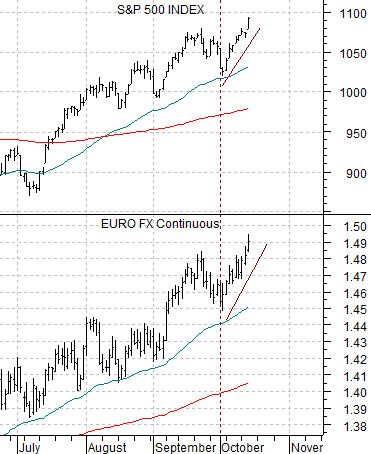
At bottom we show the same comparison over a shorter time frame. The relationship has tightened up to the point where the charts are almost interchangeable with small declines in the euro marking short-term corrections in the SPX and renewed strength in this currency indicating a return to positive stock market momentum.
So… our first page point was that at the current pace the dollar will hit a year-over-year decline of roughly 15% by the end of the month. To the extent that this has gone with dollar bottoms the stock market rally could be on borrowed time. We then argued that if ocean freight rates continued to decline while the biotech sector surged back to life… then the dollar should start to improve. Fair enough.
We have two last points that we wish to make on this topic today. We have argued in the past that when the SPX starts a quarter off by ‘driving’ higher or lower we tend to look for trend changes during the last week of the month. This quarter began with strength so it could push into November with weakness.
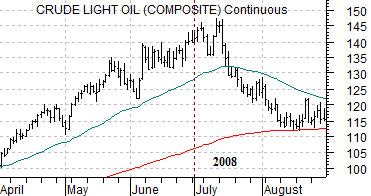
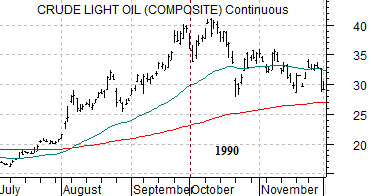
The final point is that while trends tend to change with the start of a new quarter they usually do not shift on the first day of trading. Below we have included two charts of crude oil futures. In both cases (2008 and 1990) major cycle peaks were reached during the first month of a new quarter following a push to new highs. Similar, in some ways, to the euro futures and SPX chart at bottom right.