Our thesis seems to be evolving in a bullish direction. Of course we have been positive on the equity markets since last autumn but as we run through the markets in our usual imaginative manner we keep coming up with the conclusion that a test of the highs around 1550 for the S&P 500 Index could happen within the next few months. Bold words indeed.
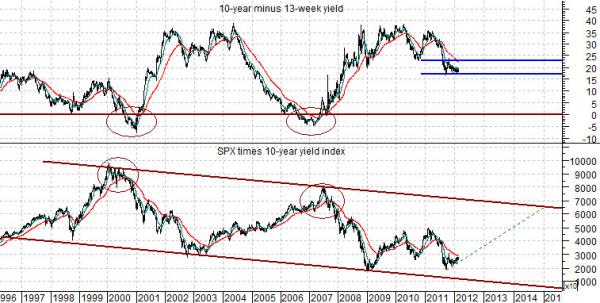
Let’s start off today with a bit of perspective. Below is a chart comparison between the S&P 500 Index times 10-year yields and the spread between 10-year and 3-month U.S. Treasury yields.
There are any number of ways to show the yield spread or curve but the one that typically has the best forecasting record is based on the yield difference between 10-year and 3-month yields. The argument is that when the spread approaches or moves below the ‘0’ line (indicating that the yield curve has inverted as short-term yields move up through long-term yields) economic growth is due to slow. While an inverted yield curve does not always precede recessions it has been decades since a recession occurred without a yield curve inversion.
In any event… we digress. Peaks for the SPX times 10-year yields are made as the yield spread moves down to ‘0’. Bottoms for the SPX times yields are made when the yield spread has been forced to peak levels.
Imagine what would happen if the Fed was actually able to hold the funds rate near 0% through 2014 and… 10-year yields simply held flat close to today’s 2% range. This would create a ‘flat’ trend for the yield spread close to 20 (2.0%) for the next few years.
Over time the SPX times 10-year yields has ranged up and down within a fairly well defined channel with a peak in 2000 and then again in 2007. By 2014 the channel top will cut through around 6500.
The point is that if, (1) the Fed holds the funds rate at current levels through 2014, (2) 10-year yields remain pinned close to 2%, and (3) the SPX times yields continues to make peaks on a 7-year cycle (2000, 2007, 2014) then we are looking at something close to 3250 for the SPX two to three years out in time. From that perspective a shorter-term projection up to 1550 seems almost timid.
Equity/Bond Markets
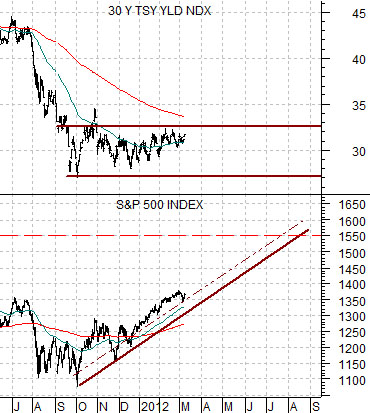
At top right is a chart of 30-year Treasury yields along with the S&P 500 Index.
The argument is that the offset or response to a ‘flat’ trend for both 10-year and 30-year yields since the end of the third quarter last year has been a powerful bullish trend for the S&P 500 Index.
Our view is that as long as yields remain close to current levels it makes sense to assume that the offset- rising stock prices- will continue. If we run a trend line up under the SPX we can make the case that the index could test the old highs around 1550 by late summer.
Quick caveat- equity market bottoms are often made on reversal days after a weak opening and a very strong close. In other words bottoms are often associated with single-day pivots. Tops, on the other hand, are slower to develop. In most cases when the SPX makes a top and then breaks lower there is a retest of the highs before prices begin to decline in earnest. All this means is that the SPX futures pushing back towards or into the 1370’s could, in theory, be consistent with a ‘top’. If prices continue to surge through 1380 then our argument that we are in a powerful rising trend will make more sense.
Now… back to business.
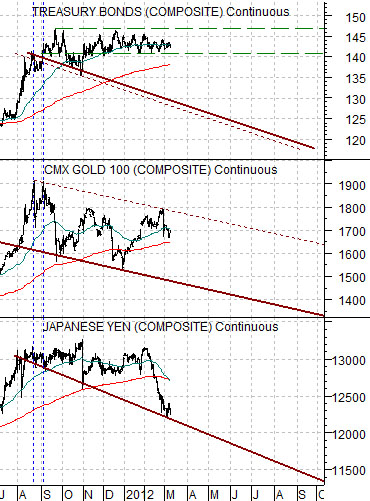
Below right is a chart comparison between the U.S. 30-year T-Bond futures, gold futures, and the Japanese yen futures. This is, by the way, an important picture in terms of the equity markets.
This particular view helps to create a potential road map for a variety of markets. It will take time to develop but in essence this is what we are looking for.
First, the trends for the TBond futures, gold, and Japanese yen should be similar.
Second, the S&P 500 Index bottomed last August when gold prices peaked. The SPX has trended higher in the face of weaker gold prices.
Third, the last trend change appears to be have been made in August of last year. This was not only when gold prices turned lower but also the point in time when the Japanese yen started to sketch out a declining trend line. Our initial point was that the TBonds should follow the same basic path.
Fourth, our sense is that bond prices are going to fight to stay near current levels as speculators borrow short-term and buy long-term on the assumption that the Fed is going to hold the funds rate near 0% through 2014.
Fifth, if gold prices and the yen continue to trend lower then eventually the bond market is going to ‘crash’. The longer it takes the more dramatic the decline.
Finally, our view is that bond prices will remain stubbornly strong for several months which provides the cover for the SPX to rise up to 1550. The first serious stock market correction should begin once bond prices start to tumble. In a perfect world… gold and the yen grind lower, the SPX pushes up to 1550, the TBonds snap down to, say, 125, the stock market corrects back into the 1300’s, and then begins to march back up to and through 1550.