We have been working with three possible scenarios that revolve around what happens next for the bond market.
The first scenario suggests that bond prices bottomed in early April as the spread between long and short-term (10-year versus 3-month) yields widened to an extreme. As bond prices continue to rise the market is telling us that a growth slow down is approaching- perhaps as a result of credit tightening in China. If this proves to be true then ideally the equity markets will remain reasonably strong through May.
The second scenario is based on renewed bond price weakness as cyclical growth accelerates to the point where the markets tell the Fed that it is time to raise the funds rate. If the markets are too far ahead of the economy the argument is that this could lead into an equity markets ‘crash’ later this year.
The third scenario includes the middle ground. Bond prices remain largely range-bound at or near current levels. Not enough bond price strength to suggest that growth is rapidly slowing and not enough bond price weakness to create a 1987- style crisis.
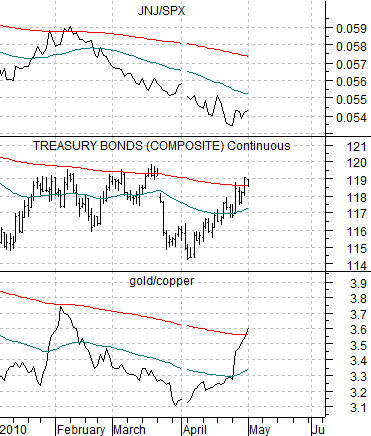
Below is a chart of the ratio between gold and copper futures, the U.S. 30-year T-Bond futures, and the ratio between Johnson and Johnson (JNJ) and the S&P 500 Index (SPX).
Further below we feature a chart of the TBond futures along with the ratio between gold futures and crude oil futures.
In general the JNJ/SPX ratio tracks with the bond market. Rising bond prices indicate slowing cyclical growth and this tends to herd money back towards the more stable consumer growth and health care themes.
The charts show that the long end of the Treasury market has been rising over the past month and that gold apparently got the memo. The gold/copper ratio has been higher- which is what one should expect- while the gold/crude oil ratio has also been somewhat better.
If the bond market really has turned higher (in price) then the JNJ/SPX ratio should start to rise. Our problem is that as recently as this past January the TBonds, gold/copper, and gold/crude oil all pushed back up to the 200-day e.m.a. line before failing lower. Our point is that after a month of bond price strength it is still difficult to call this a trend change.

Equity/Bond Markets
There is one fairly good reason why we would prefer an outcome that does not involve rapidly rising bond prices. For all intents and purposes this would blow our ‘Japan’ argument out of the water.
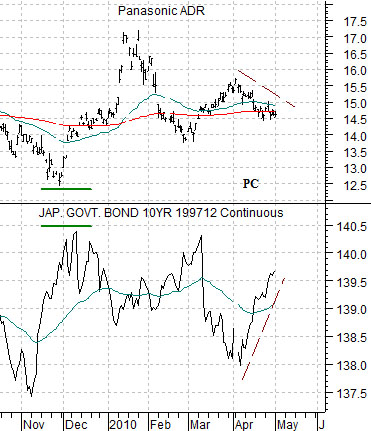
Below we show Panasonic (PC) and the Japanese 10-year (JGB) bond futures.
The argument is that for years and years the only time the Japanese stock market rises is when bond prices are declining. The chart shows that each time the JGBs swing higher the share price of PC mirrors the move by moving lower.
It is possible for Japanese bond prices to decline when U.S. bond prices are rising- at least in theory- but this would work much better if the U.S. bond market remained flat to lower through the quarter.
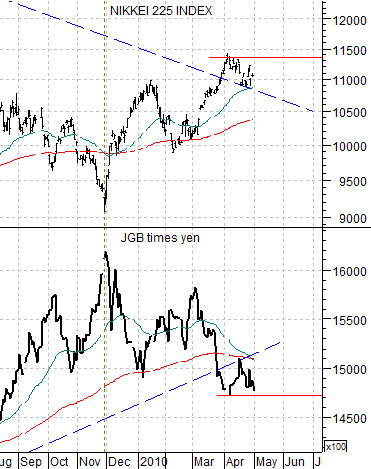
Below we compare the Nikkei 225 Index with the combination of the JGBs times the Japanese yen futures.
The idea is that the Nikkei does better when bond prices are falling and also when the yen is weaker. The combination of the JGBs times the yen should trend in the exact opposite direction of the Nikkei 225 Index. Notice that the trend has been in favor of the Nikkei since the U.S. dollar turned higher at the end of last November.
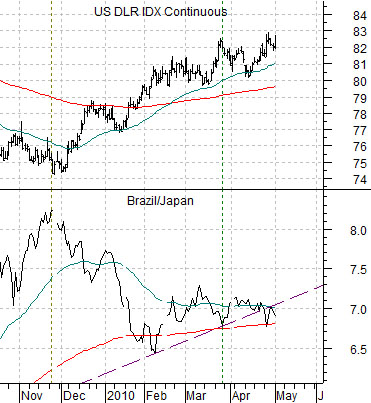
Lastly is a comparative view of the U.S. Dollar Index (DXY) futures and the ratio between the Brazil etf (EWZ) and Japan etf (EWJ).
When the dollar turns higher the Dow Jones Industrial Index (large cap U.S. equities) tends to outperform most foreign markets while the Nikkei tends to do better than many of the BRIC-related themes. In other words the Brazil/Japan ratio is expected to decline when the dollar starts to trend upwards. So far… so good.


