Our theme through this week has revolved around the bond market. We have mentioned that we can make reasonable arguments for rising bond prices as well as falling bond prices so our intention was to focus today on relationships that point to rising interest rates and lower long-term Treasury prices.
One argument in favor of rising yields revolves around the ‘decade theme’. Asset prices have tended to peak in the ‘0’ year (1980, 1990, 2000), tumble into the ‘2’ year, rally during the ‘3’ year, and then remain under pressure into the ‘6’ year. From there a speculative rally develops into the ‘7’ year that leads into a collapse. The 1987 stock market crash and 1997 Hong Kong stock market break are examples of the theme as well as the start of weakness in the U.S. financials in 2007.
After a cleansing decline the cycle begins to build to the upside coming out of the autumn of the ‘8’ year with strong gains through the ‘9’ year. Rinse and repeat. In terms of the decade theme 2009 should see steadily rising asset prices until a cycle top is reached in 2010. We have included a few more comments on this argument on page 5 today.
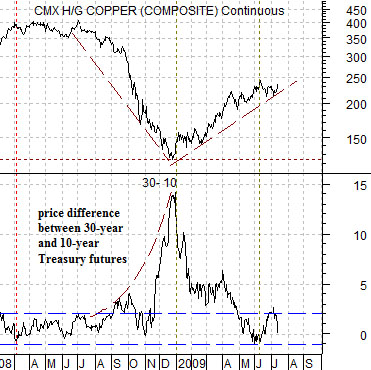
At top right we show copper futures and the price spread or difference between 30-year and 10-year U.S. Treasury futures. The spread tends to rise when bond prices are stronger and decline when bond prices are weaker. In trading yesterday the 30-year T-Bonds fell around 126/32 while the 10-years lost 1 2/32. The spread narrowed by 3/4 of a point.
The argument is that tops for copper over the past year or so have been reached when the spread falls to around -1. In other words a push back towards 2.50 for copper should go with bond price weakness until the spread moves a point or so lower.
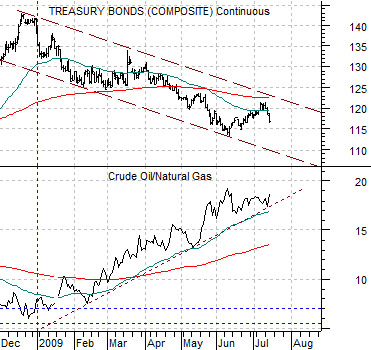
At bottom right we compare the TBond futures with the ratio between crude oil and natural gas futures.
As bond prices have declined this year the price of crude oil has risen relative to natural gas. The trade was on once again yesterday as crude oil rose more than 3% while gas fell over 3% in price. Our thought is that the longer this trade continues the greater the risk of new lows for the front month natural gas futures contract. The closer the ratio gets to moving above 20:1 the stronger the odds of natural gas prices breaking down below 3.00.
Equity/Bond Markets
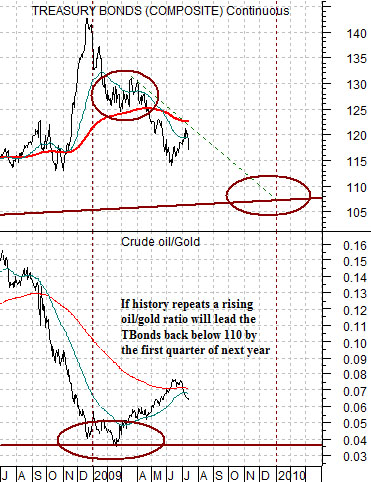
We are returning to a chart comparison that we have shown on a few occasions over the past number of months. The comparison is based on the U.S. 30-year T-Bond futures and the ratio between crude oil futures prices and gold futures prices.
The chart at right is from 1993- 1995. In early 1994 the oil/gold ratio declined to just over .035 while the TBonds were trading close to the 200-day e.m.a. line. As oil prices rose relative to gold prices the long end of the Treasury market declined until a bottom was reached in the 4th quarter of the year.
In early 1999 the oil/gold ratio declined to just above .035 once again and, similar to 1994, the TBonds were close to their 200-day e.m.a. line. The oil/gold ratio began to rise pushing bond prices to the down side.
The oil/gold ratio fell for a third time through the end of 2008 reaching the .035 level in February. The argument was that this should go with the TBonds declining to the 200-day e.m.a. line which, with a bit of hindsight, is exactly what happened.
As the oil/gold ratio began to rise the TBonds broke below the moving average line in a manner consistent with the two previous instances. The argument was that as long as oil prices were rising relative to gold prices the basic trend for the long end of the Treasury market should be lower with a projected bottom for the TBonds somewhere between 105 and 110 towards the end of the year. The point, however, is that this argument depends on oil prices rising relative to gold prices which has not been the case this month. To keep the ‘lower bond price’ trend intact the ratio has to swing back above the moving average lines and the June highs either through strong oil prices or weaker gold prices.