One of our basic views is that we should never (ever!) argue with the bond market. Instead of trying to keyhole the bond market into our assortment of intermarket perspectives it makes more sense to accept that the bond market is invariably ‘right’.
If yields are trending higher then we need to figure out how this is impacting relative strength in the other markets and when yields are falling we need to discern where the weakness is.
So… for good or for bad… we approach today’s topic with a bit of trepidation as we search for some indication that the bond market has taken a temporary wrong turn.
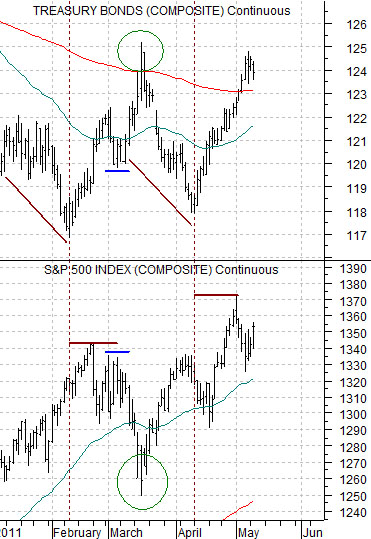
Below is a chart of the U.S. 30-year T-Bond futures and the S&P 500 Index (SPX) futures. The premise is that in recent years the bond market has tended to trend in the opposite direction of the equity market.
In early February this year the bond market pivoted upwards. There was a period of time into March when the SPX held fairly well even as bonds pushed higher indicating some sort of slowing in the growth trend.
Eventually the TBonds spiked above the 200-day e.m.a. line in mid-March and turned back to the down side as the equity markets reached bottom and pushed higher.
The TBonds pivoted upwards once again in early April and while the initial reaction for the SPX was negative by mid-month the index was moving on to new recovery highs. Was there, in fact, a lag between the bond market’s message of decelerating growth and the equity market’s realization of the inevitable? Was the equity market awaiting a short-term bond price pull back similar to the first few days of March before responding? Or… was a push above the 200-day e.m.a. line by the TBonds the ‘all clear’ signal for the equity markets?
Our thoughts are that a market (in this case the SPX) that won’t go lower on bad news is likely to go much higher once the news turns more positive. If the SPX can rise in the face of a surging bond market then it may, in fact, be much stronger than most realize.
The caveat is that we may just be replaying the relationship established between late February and early March. If the TBonds turn lower for a few days and the SPX rallies up to but not above the recent peak near 1370 then it is conceivable that on the next surge in bond price strength the SPX will break back below 1300.
Our point? The TBonds and Japanese yen have almost identical near-term charts. Our view is that the yen is at a point where it either accelerates strongly higher- with negative implications for growth and equity prices- or snaps back to the down side. The SPX still appears to be giving the recovery the benefit of the doubt but the true test may come later this week after the bond market and yen have corrected a bit lower.
Equity/Bond Markets
In a sense the most logical question with regard to the equity markets is… when will the next correction begin? The twist is that a better question might be… when will the current correction come to an end?
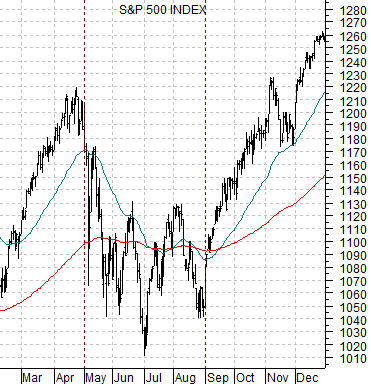
Below is a chart of the S&P 500 Index from 2010.
The equity markets declined from the end of April through the end of August last year concurrent with the problems in the Eurozone. There was a four-month period of downward price pressure that ultimately led to a powerful recovery.
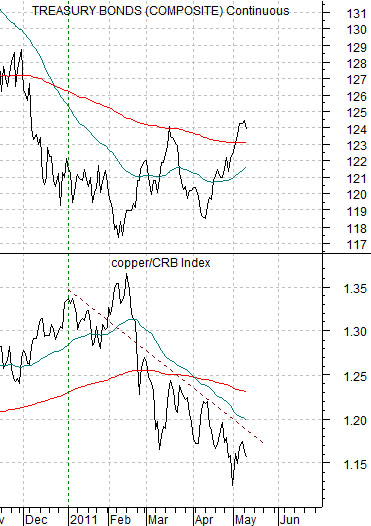
Below is a chart of the U.S. 30-year T-Bond futures and the ratio between copper futures and the CRB Index.
If we view the trend through the copper/CRB Index ratio we can see that prices have been under pressure since the start of this year as a state of crisis built in the oil producing regions of North Africa and the Middle East. Whether the negative trend began in January or, perhaps, early February is somewhat less important than the point that a negative trend already exists.
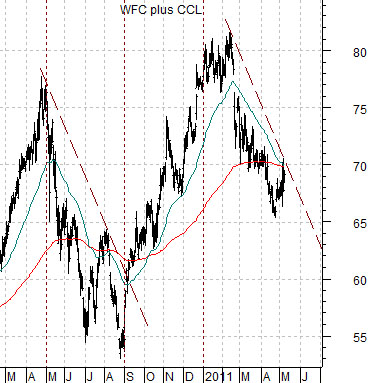
Last is a chart of the sum of two stock prices. We have argued over the past number of years that the trend for U.S. bank Wells Fargo (WFC) is very similar to the trend for cruise ship operator Carnival (CCL) so we have combined the two themes by adding the same prices together.
The sum of WFC and CCL declined for four months last year between the end of April and the end of August. The same sum has been lower since January or February of this year. The argument isn’t when the stock market’s correction will begin because… it actually started month ago… but rather when it will come to an end. Our answer is that it will end once the bond market stops rising and since the bond market’s trend is so similar to that of the Japanese yen… a better answer might be that it will end when the sum of WFC and CCL rises nicely above ‘70’ as bond prices and the yen turn clearly lower with confirmation from the Nikkei 225 Index as it closely well above 10,000.