Our focus through much of the past few months has been on the bond market. The argument is that a trend that favors cyclical growth will tend to go with falling bond prices and rising long-term yields.
There are periods of time when the equity markets rise along with bond prices but over the past decade in the U.S. and perhaps as far back as 1994 for Japan rising stock markets have generally gone with falling bond prices.
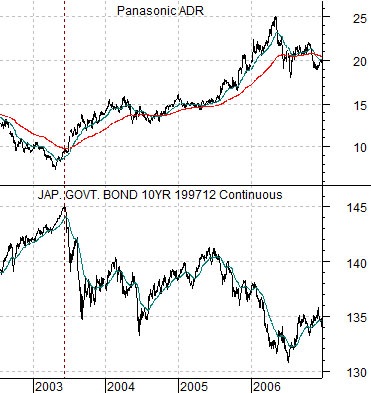
Below we show a comparison between the Japanese 10-year (JGB) bond futures and the share price of consumer electronics maker Panasonic (PC) from 2002 through 2006.
The chart shows that Japanese bond prices peaked during the second quarter of 2003. We grant that PC had already made a running start into a rising trend during the final stages of the bond price rise but over the longer run a negative trend for Japanese bonds will tend to go with a rising and positive trend for the Japanese stock market. Fair enough.
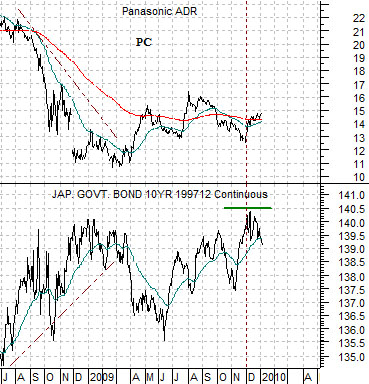
Below we show the same comparison for the time frame following the summer of 2008.
The key point that we wish to make emanates from the chart of the JGB futures. Notice that prices rose to a peak into December of 2009. This is important because it describes a fairly significant divergence between the U.S. and Japanese bond markets. Why? Because U.S. bond prices reached the highest levels in December of 2008- a full year ahead of the Japanese bond market.
If falling bond prices indicate economic growth or recovery then the argument would be that the U.S. began to expand or, perhaps, stop contracting, towards the end of 2008 while Japan’s malaise stretched all the way through 2009.
It is easy to dislike the Japanese equity markets for all of the reasons that every one seems to know and agree upon. Japan’s economy has been under considerable pressure for the past two decades which is likely enough to convince an entire generation to push money in other directions. From our perspective, however, the most important issue is not what every one knows but rather the direction of the long end of Japan’s bond market. If the JGBs continue to decline in price then a strong case can be made for better Japanese growth ahead and considerably better price action from its equity market.


Equity/Bond Markets
Today we argued that strength in Japan’s bond market from December of 2008 into December of 2009 explains why the Nikkei has lagged behind during the global stock market recovery. To kick the Nikkei into a higher gear requires falling bond prices. In other words… a strong and rising ratio between the Nikkei and the JGB futures.
Below we compare the ratio between the Nikkei 225 Index and the JGB 10-year futures with the share price of Japanese bank Mitsubishi UFJ (MTU).
The point is that the Nikkei/JGB ratio and the price of MTU are extremely similar which means… that one of the keys for better action from MTU is a declining bond price trend. At best the Japanese bond market turned back to the down side about a month ago. We take this as a tentatively encouraging sign.
We argued in yesterday’s issue that there were (at least) two ‘stops’ that we were using to swing us away from a positive equity markets stance. One of them revolved around untoward strength in the Japanese yen while the other had to do with U.S. 10-year Treasury yields.
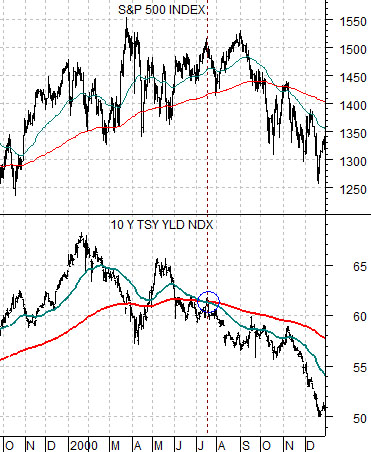
To finish the explanation we return to the year 2000. At top right we compare the S&P 500 Index (SPX) with the yield index for 10-year U.S. Treasuries (TNX) from the autumn of 1999 through 2000.
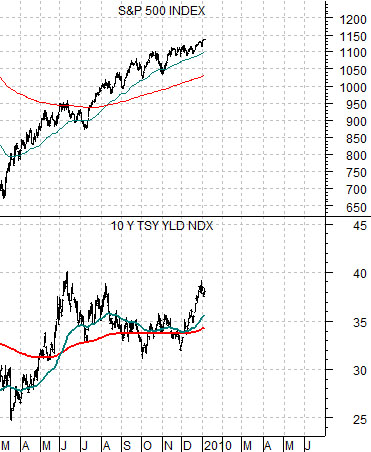
The point is that the entire post-Nasdaq ‘bubble’ equity bear market that extended from the fourth quarter of 2000 through into late 2002 (or early 2003 in the case the Japan) began with falling long-term Treasury yields. Months before the Fed realized that there was a problem and even as investors were busy buying Nortel, Cisco, and Intel on dips… 10-year Treasury yields fell below the 200-day moving average line followed by a ‘cross’ down through that line by the 50-day e.m.a. Our view at present is that as long as yields (chart below right) are above the moving average lines we need to err on the side of bullish optimism.


