We are not sure whether today’s effort is going to make sense but we will try our best. The premises are as follows. First, the current market cycle is somewhat similar to the Nasdaq’s peak into 2000. Second, the equity markets relate to the bond market on two different time frames. There is a lagged relationship of close to two years combined with a real time relationship.
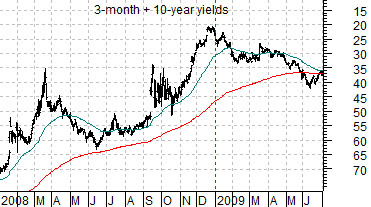
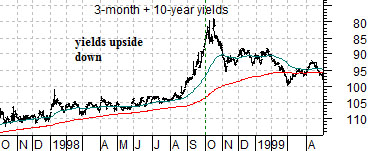
Below is an upside down chart of the sum of 3-month and 10-year yields from October of 1997 into April of 1999. Our focus is the peak in October of 1998. With yields scaled inversely this peak represents the top for bond PRICES. The 2-year lag argues that a peak for bond prices should lead to a cyclical top for asset prices two years later.
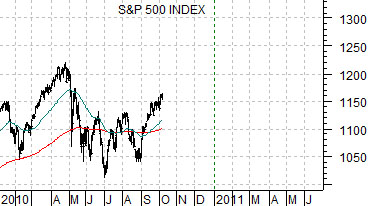
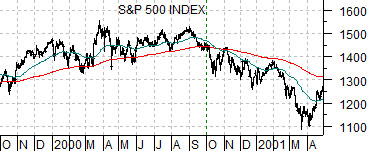
The next chart is the S&P 500 Index (SPX). This chart covers the time period from October of 1999 into April of 2001. In other words we are looking at equities two years after the chart for yields.
If the 2-year lag makes sense then there should be some kind of top for equities around the end of the third quarter in 2000. The chart shows that while the relationship wasn’t perfect it was fairly close as the SPX turned into a bear market in September of that year.
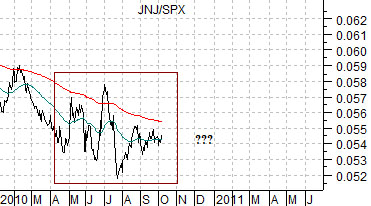
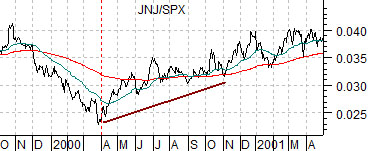
The third chart shows the ratio between Johnson and Johnson (JNJ) and the S&P 500 Index (SPX). What we are trying to show using this ratio is that the tail end of the equity market’s rally in 2000 included a theme change away from ‘cyclical’ (i.e. Nasdaq) and back to defensive (JNJ). Put another way… even though the upside down yields chart shows a parabolic rise into the autumn of 1998… it was the defensive sectors that helped push equities higher into the autumn of 2000.
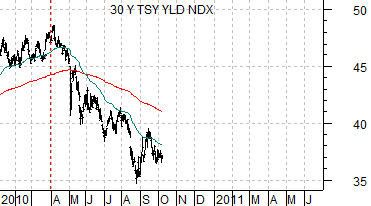
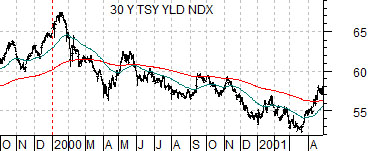
So… why did the defensive stocks start to rise? The answer has to do with the way equities and bonds related in ‘real time’. At bottom right is a chart of 30-year Treasury yields over the same time period.
Notice that long-term yields began to decline in January of 2000. A couple of months ahead of the peak for the Nasdaq in March and close to nine months ahead of the start of actual cyclical weakness long-term yields began to fall. By the following quarter weakness in the economically sensitive sectors began to show up leading to an upward turn in the JNJ/SPX ratio.
Equity/Bond Markets
Let’s take the same four charts that we used on page 1 and shift them forward in time so that we compare the current situation to 1998- 2000.
We already have to ‘time points’ to add into the equation. We know, for instance, that yields made a crisis bottom in December of 2008. On our upside down chart of the sum of 3-month and 10-year yields included at top right this shows up as a peak.
We also know that long-term yields began to trend lower in the second quarter of this year. This is indicated by the falling trend for 30-year yields on the chart at bottom right.
So… the asset price peak in 2000 trailed the low point for yields in 1998 by close to two years. The Nasdaq peaked in March of 2000, copper prices peaked at the end of September that year, and crude oil futures reached a cycle top between September and November. The 2-year lag argues that equity and/or commodity prices should have topped out around the start of the fourth quarter so this was fairly accurate.
Based on the low point for yields at the end of 2008 the argument points to a top for asset prices close to the end of this year. We are attempting to rationalize the 2-year lag with the ongoing down trend for long-term yields.
Let’s circle the wagons somewhat and come at this from another direction. If the entire argument actually works then what sectors should we be focusing on during the final quarter of this year? Should we be long the cyclicals because the 2-year lag argues for a cyclical peak around year end or… should we be focusing on defensive names to take advantage of falling yields?
We probably won’t know the answers to our questions until six months from now but the sector that intrigues us the most at present is… the banks. Typically we distill ‘the banks’ down to the stock price of Wells Fargo although we did suggest yesterday that the ‘laggard banks’ (Citigroup, Mitsubishi UFJ, and Mizuho) were starting to perk up.
Why the banks? Because of where the bond market and gold are at present.
The bank have been weaker as yields have declined. When the banks are weaker the price of gold tends to rise. Fair enough.
If yields were ‘high’ and the price of gold was under duress then it would make sense that a trend change would include lower yields and higher gold prices. This kind of scenario favors the gold miners, of course, as well as the defensive stocks.
With yields currently ‘low’ and the price of gold ‘high’ (in our view) the most likely trend change coming out of October would be rising yields and downward pressure on gold. Both have everything to do with stock price strength for the banks so for the final quarter of this year we will pick both ‘the banks’ (WFC) and the ‘laggard banks’ (C, MTU, MFG) as our sector favorites.