Over the years we have used quite a number of individual stocks to represent a variety of themes. A number of our core indicator stocks have disappeared through takeovers or mergers including Phelps Dodge, Alcan, Inco, Anheuser Busch, Schering Plough, and Genentech and when this happens we have to scrap all kinds of comparative charts and analysis.
Our premise is that individual stocks represent much broader themes. An oil stock, for example, represents energy prices, a base metals miner trends with base metals prices, and a gold miner moves with gold prices. A consumer staples company or drug maker will be driven by a different set of ‘intermarkets’ than, say, an auto or an airline.
As the years tick by there is always the chance that a company’s fortunes and business will have changed to the point where it no longer represents the same trend. We often struggle with the difference between causal and coincident. By this we mean that when an individual stock goes on a tear it may be due to factors specific to the company and not based on a relationship to macro factors. Such is perhaps the case with Boston Scientific (BSX).
Our view is that until BSX does something surprising or fails to respond to a new trend in a manner that we can rationalize we will continue to use it as an indicator. Whether this is a good decision or not remains to be seen.
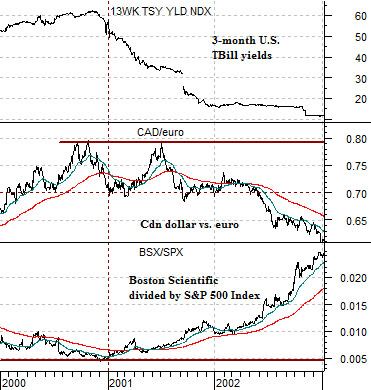
Just below is a comparison between U.S. 3-month TBill yields, the cross rate between the Cdn dollar and euro, and the ratio between BSX and the S&P 500 Index from 2000 through 2002.
The premise is that when short-term OR long-term yields change direction the trend within the equity markets change as well. At the end of 2000 short-term yields began to tumble with the CAD/euro up near the cycle highs. This marked the bottom for BSX relative to the SPX.
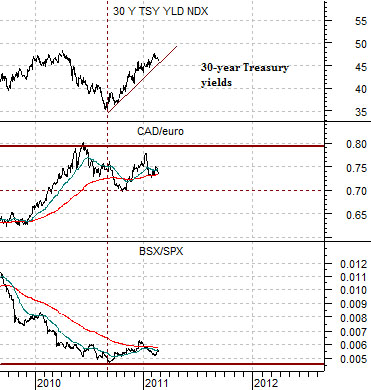
The current situation is shown below right. We have substituted 30-year yields for TBill yields. The argument is that in the current situation a new trend began when long-term yields began to rise last autumn in response to rising short-term yields in China. Once again the Cdn dollar/euro cross rate was trading between .70 and .80 with the BSX/SPX ratio under .005. From an intermarket stand point it ‘feels’ as if BSX has turned higher relative to the broad market in a manner somewhat similar to 2001.
Equity/Bond Markets
Feb. 24 (Bloomberg) — Saudi Arabia and other OPEC nations including those in West Africa are willing and able to replace any lost Libyan oil as soon as companies ask for it, including crude of the same quality, a Saudi Arabian oil official said.
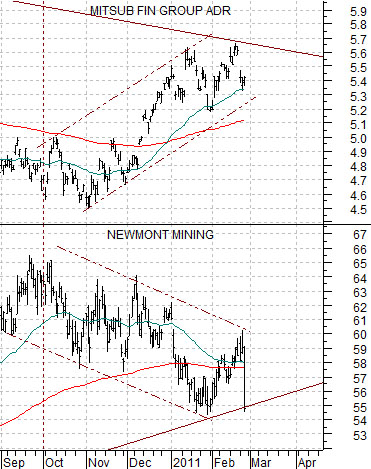
Saudi assurances that crude oil would remain well supplied helped weaken oil and gold prices yesterday while elevating the equity markets. Long before this happened, however, the share price of gold miner Newmont (NEM) tanked following guidance with respect to 2011 production.
Our argument has been the when yields turned higher last autumn the equity markets shifted gears. The ‘shift’ included strength in the banks (we show Mitsubishi UFJ at right) and weakness for gold (i.e. Newmont). The new trend was given a thorough stress test over the past month as gold prices and NEM trended higher. While NEM did nothing more than give back February’s price gains while holding long-term support this is the sort of thing that one would expect to see when prices are rising in the face of a negative trend.
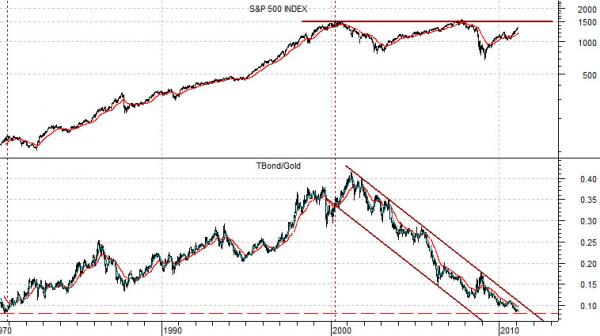
Below is a long-term view of the S&P 500 Index and the ratio between the U.S. 30-year T-Bond futures and gold futures.
The question is… now what? The TBond/gold ratio bottomed in September of 1980 when the TBonds were around 60 and gold was just over 700. Today the TBonds have doubled to around 120 and gold has doubled to around 1400. In other words after 20 years of rising equities the gold/TBond ratio has spent a decade declining all the way back to its original starting point.
Our thought is that a new cycle will be sparked by a push to new highs for the SPX. If history repeats perhaps gold will rise to prominence once again after another 20 year hiatus.