We could probably think of all kinds of pithy things to write but have decided to let Mr. Buffett start things off today for a change. This is an excerpt from his annual letter to shareholders published on the Fortune.cnn.com web site:
Mr. Buffett states, “Today the world’s gold stock is about 170,000 metric tons. If all of this gold were melded together, it would form a cube of about 68 feet per side. (Picture it fitting comfortably within a baseball infield.) At $1,750 per ounce — gold’s price as I write this — its value would be about $9.6 trillion. Call this cube pile A.
Let’s now create a pile B costing an equal amount. For that, we could buy all U.S. cropland (400 million acres with output of about $200 billion annually), plus 16 Exxon Mobils (the world’s most profitable company, one earning more than $40 billion annually). After these purchases, we would have about $1 trillion left over for walking-around money (no sense feeling strapped after this buying binge). Can you imagine an investor with $9.6 trillion selecting pile A over pile B?
Beyond the staggering valuation given the existing stock of gold, current prices make today’s annual production of gold command about $160 billion. Buyers — whether jewelry and industrial users, frightened individuals, or speculators — must continually absorb this additional supply to merely maintain an equilibrium at present prices.
A century from now the 400 million acres of farmland will have produced staggering amounts of corn, wheat, cotton, and other crops — and will continue to produce that valuable bounty, whatever the currency may be. Exxon Mobil will probably have delivered trillions of dollars in dividends to its owners and will also hold assets worth many more trillions (and, remember, you get 16 Exxons). The 170,000 tons of gold will be unchanged in size and still incapable of producing anything. You can fondle the cube, but it will not respond (emphasis ours).”
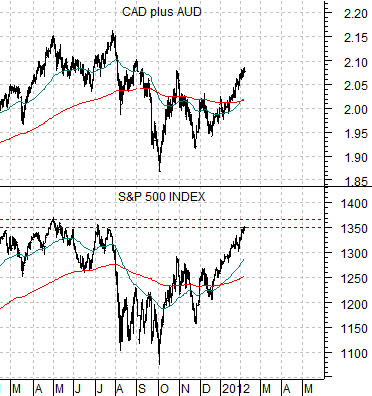
Below s a chart of the sum of the Cdn and Australian dollar futures along with the S&P 500 Index. The argument has been that the SPX will find first resistance between 1350 and 1360. Our thought is that this will go with some amount of weakness in the commodity currencies. The comparison at right suggests that the CAD and AUD have trended very closely with the SPX since mid-December of last year.

Equity/Bond Markets
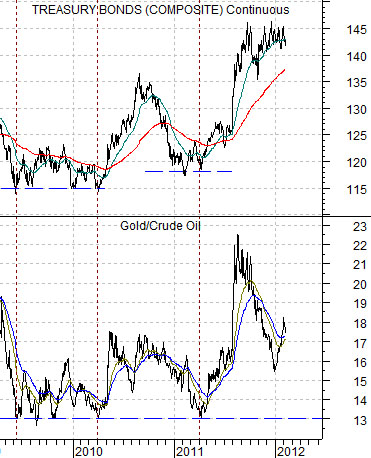
Below is a chart comparison between the U.S. 30-year T-Bond futures and the ratio between gold and crude oil futures.
First, notice that on a number of occasions from 2009 into 2011 the gold/crude oil ratio declined to 13:1. In general a gold/crude oil ratio of 13:1 went with a bottom for long-term bond prices.
Second, notice that the gold/crude oil ratio has been declining since last August. We will continue on with this point on today’s third page.
Third, if we pick a number like ‘100’ for crude oil and then apply a 13:1 ratio we come up with the argument that gold prices could decline to 1300 if bond prices continue to trend lower.
Fourth, the upward pressure on oil prices is, we believe, a function of the fact that gold prices have yet to seriously decline. The weaker the price of gold the less positive price pressure for crude oil within a falling bond price trend.
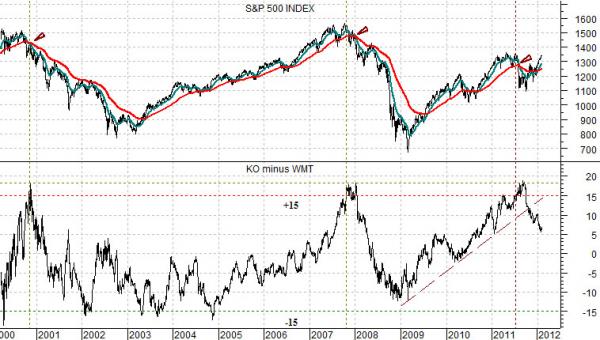
Below is a rather strange comparison between the S&P 500 Index (SPX) and the price spread or difference between Coca Cola (KO) and Wal Mart (WMT).
On three occasions since 2000 the SPX has peaked and turned lower once the price of Coke has risen to more than 15 points higher than that of Wal Mart. The last time this happened was in July of 2011 as the SPX rose towards 1350 only to decline back to 1100 during August and September.
The point? A bullish trend should carry both KO and WMT upwards but if the trend favors KO to the point where the spread rises to more than 15 points… history argues that heading to cash might not be such a bad idea.