We are positive on the equity markets. We were, in fact, positive on the equity markets since the start of the current quarter although over the past few weeks our focus has largely been on ‘when’ our positive view will actually fall into line with rising equity prices.
For us the issue hasn’t really been a matter of positive or negative but rather ‘why’. What sectors or themes will lead the rally once long-term bond prices stop rising at such a frenetic pace? Will bond prices flatten out near the highs or simply collapse? Will pressure on bond prices come from Asian growth and strong copper prices? When will the double-dippers realize that slow but steady growth, reduced inflation expectations, and rising corporate earnings and profit margins are not the stuff of bear markets?
In any event… our sense is that the most likely outcome will be an extension of the 2009 rally rather than a completely different theme. The way the stock market bolted higher yesterday on stronger commodity prices and a weaker U.S. dollar suggested to us that our 2-year lag argument still has a fighting chance of driving the cyclical trend sharply higher into year end.
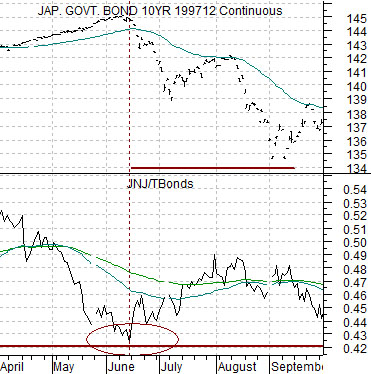
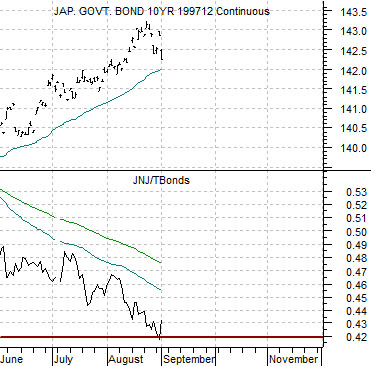
We are going to take another quick run at the chart-based argument that we ran in yesterday’s issue. At top right is a comparison between the Japanese 10-year (JGB) bond futures and the ratio between the share price of Johnson and Johnson (JNJ) and the U.S. 30-year T-Bond futures from 2003. Below right we feature the same comparison for the current time period.
30-year Treasuries currently yield 3.66%. JNJ’s dividend yield is 3.70%. If you hold the TBond to maturity your yield will be 3.66%. JNJ, on the other hand, has increased its dividend each and every year for decades. One might argue that based on today’s fiscal situation JNJ may well be a better credit risk…
The point is that in 2003 the peak for Japanese bond prices was reached around the time that the JNJ/TBond ratio fell to roughly .42. At the end of August the ratio had once again declined to .42 amidst nascent signs of weakness in the Japanese bond market. All things considered our thought was that while we might still be a bit early on our positive view… as long as the Asian growth trend holds positive any set up that argues that today is similar to mid-2003 points to a bullish outcome.
Equities/Bond Markets
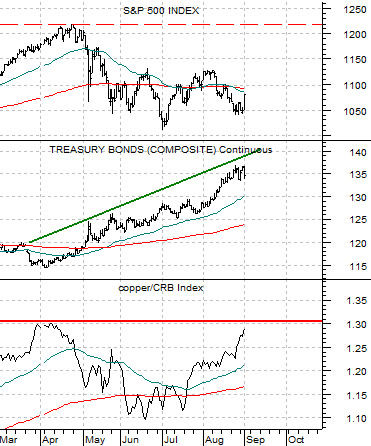
Below is a comparison between the S&P 500 Index, the U.S. 30-year T-Bond futures, and the ratio between copper and the CRB Index.
The thought is that the SPX is trending with the copper/CRB Index AND is trending inversely to the bond market. In other words the copper/CRB Index ratio is pulling equity prices higher even as the TBond futures keep pushing them lower.
We were pondering this week what might happen to the bond market IF the copper/CRB Index moved to new highs. Something above 1.3:1 would suggest at least the potential for the SPX to return to the April highs and that, we suspect, would flatten out the trend for bond prices.
If we had to guess (and we don’t but we will anyway) we would suggest that the SPX has the potential to be back close to 1200 by the end of this month. If we had to guess we would proffer that if bond prices stay relatively flat into October then they could get hammered over the first two months of the fourth quarter.
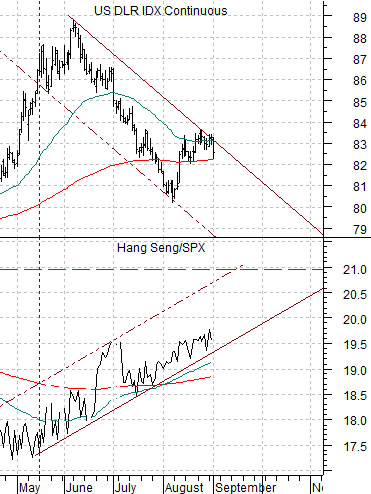
Anyway… enough guessing for today. At bottom right we show the U.S. Dollar Index (DXY) futures and the ratio between the Hang Seng Index and the S&P 500 Index. The trend for equities turned positive in May when the dollar started to weaken. This would appear to be the underlying trend so dollar weakness from the channel top yesterday was right on time and right on point.
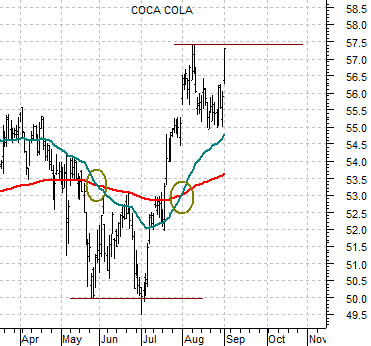
Below is a chart of Coca Cola (KO) with the usual 50-day (blue) and 200-day (red) exponential moving average lines.
One of our view is that when the moving average lines ‘cross’ there is usually a counter-trend move back towards the moving average lines. Once the correction has been completed a move to a new extreme ‘sets the trend’. Notice how KO’s decline into early July failed to break to new lows? This led directly into a rally that crossed the moving average lines back to the upside with a peak set in early August. From this perspective KO could fail at or near current levels to indicate that it is too early for a positive trend or… it could make a successful break to new highs above 57.50 which would tip the odds in favor of broadly positive equity markets outcome.