From time to time we like to focus on playing defense. By this we mean that when the trend is running hard in one direction we try to find some kind of argument that would support a reversal of that trend. Today we are going to approach this from a different perspective as we take a look at an outcome that, we suspect, might serve as something of a surprise to many investors and traders.
The argument is that just about everyone who has ever looked at a chart can see quite easily that the S&P 500 Index is going to run into resistance around the 1350 level. So… what happens if the index doesn’t stop at 1350? What might that mean to the sellers who got out in recent days based on the expectation that prices would consolidate or correct down from 1350? What might that mean to the bears who were convinced that this is nothing more than a speculative short-term rally in an ongoing down trend?
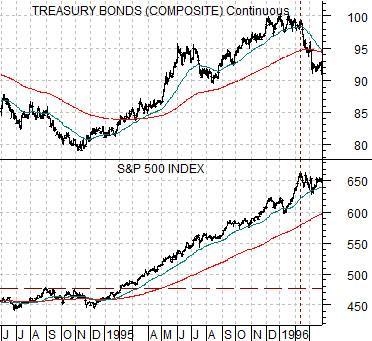
First is a chart of the S&P 500 Index and the U.S. 30-year T-Bond futures from 1994- 96. We are using this chart as a comparison for two reasons. First, the pivot upwards for the SPX in late 1994 was related to a change in the direction of the bond market. Second, the rally that began in late 1994 had the same kind of relentless upward push based on low volatility with corrections holding at or above the 50-day e.m.a. line that the markets have exhibited over the past month or two.
The idea is that the SPX turned higher as bond prices bottomed and moved upwards. The SPX pushed to new recovery highs in early 1995 and then continued to grind upwards… until the bond market reached a price peak a year later in early 1996.
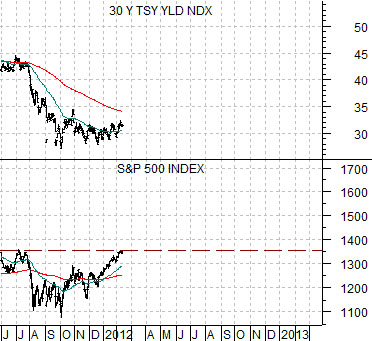
Below we show the SPX and the yield index for 30-year Treasuries. Note that we are using yields for the current case and prices for the comparison in the 1994- 96 example.
Many believe that the stock market should not be rising because yields are not soaring higher but that might miss the key point. If the rally is going to continue until yields peak then wouldn’t it make sense to argue that the slower the pace for rising yields the better? Instead of a ‘V-shaped’ pivot for yields that compresses the time available for an equity markets bull run what if yields drifted slowly higher through the balance of 2012? That might, in fact, leave a great many investors on the side lines hoping for a pull back from ever higher levels.
Equity/Bond Markets
At present long-term Treasury yields are being pushed upwards by an improving U.S. economy while being pushed downwards by the never ending series of crises in the Eurozone and the prospect of a hard landing in China.
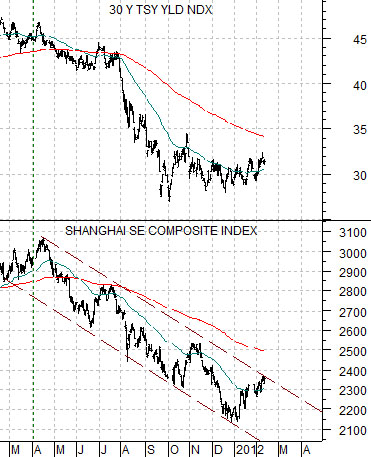
Below is a comparison between 30-year Treasury yields and China’s Shanghai Stock Exchange Composite Index.
The argument is that lower interest rates are always a positive for financial assets while ‘the reason’ interest rates are falling is always a negative. In other words stock valuations benefit from falling yields but the positive impact is usually more than offset by economic weakness and collapsing profits.
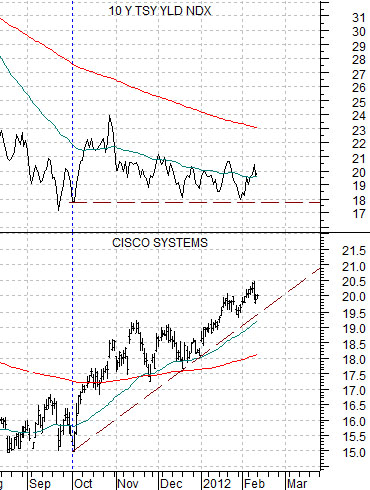
So… what if the reason yields are under pressure has nothing to do with a company’s or sector’s fundamentals? What if, for example, a slow down in China’s growth has little impact on, say, Cisco’s (CSCO) sales and earnings? The chart below right shows that once long-term U.S. yields stopped falling last autumn the trend for Cisco’s share price turned bullish. While investors fret about Greece and its potential to roll through Portugal, Spain, and Italy the markets are ‘saying’ that as long as yields aren’t making new lows the trend for many stocks is quite clearly higher.
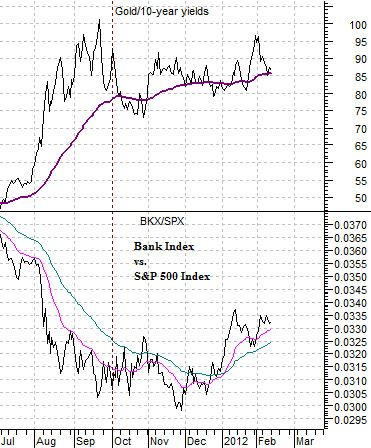
Below is a chart of the ratio between gold and 10-year yields and the ratio between the Bank Index and S&P 500 Index (BKX/SPX).
Instead of drama and fire works what we have been getting since September of 2011 is a very slow trend change. The gold/yields ratio represents ‘bearish stress’. The BKX/SPX ratio represents ‘bullish recovery’. The gold/yields ratio is holding its moving average line while the ratio between the banks and broad market is gradually resolving higher.