In years past we argued (repeatedly) that the markets were following the same basic trend each year. The first six months would include a very strong energy price trend while the final six months of the year would feature a rotation over to ‘something else’. The ‘something else’ might be the energy ‘users’ (autos, airlines, etc.), defensives (consumer, pharma, interest rate sensitive, etc.), or even gold and the gold miners.
In a sense this is exactly how 2008 played out with crude oil futures prices driving higher through the end of June followed by a ‘something else’ that focused on rising bond prices and then a rebound for gold.
On an intermarket basis there were all kinds of reasons to believe that oil prices were far ‘too high’ heading into 2008 while from a technical perspective it is always difficult to be bearish a market that keeps making new highs every second or third day. Eventually the positive momentum came to an end with oil prices collapsing through the back half of 2008.
Given that we once again believe that crude oil prices are much ‘too high’ we find ourselves (once again) trying to find some reason why the current rally is not going to push on for another three or four months. Please keep in mind that we may be stretching the limits of logic in order to justify our intermarket conclusions.
The thought is… that the positive energy price trend that used to run from the start of the year through the end of June may have shifted forward by three months. Crude oil futures prices rose from around 75 in September of 2010 up to a peak close to 115 in April of 2011. In other words instead of January through June the trend may now be closer to September through March.
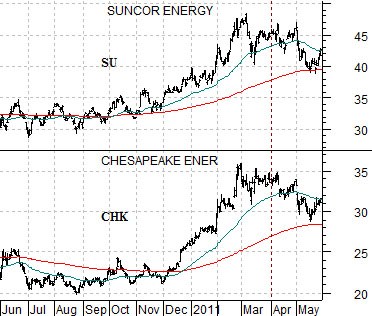
First is a chart of Suncor (SU) and Chesapeake (CHK) from 2010- 11. Notice that the oil stocks peaked in price towards the end of the first quarter last year.
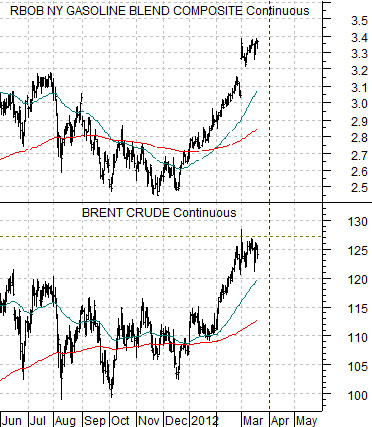
Next is a comparison between gasoline futures and Brent crude oil futures from the current time frame. The argument is that the rising trend for Brent and gasoline prices this year appear similar to the positive trends for the energy producing stocks into March of last year. Which, of course, would suggest that we could be fairly close to the end of the positive energy price trend.
Equity/Bond Markets
Let’s make an assumption or twelve. Let’s assume that the price of Brent crude futures (as well as gasoline futures) have been bid far too high due to concerns about a reduction in supply from Iran. Let’s assume that Saudi Arabia is correct in its assertion that it has the spare capacity to replace 100% of Iran’s production (Iran produces around 2.5 million bpd while Saudi Arabia argues that it can increase production by 2.5 million bpd at any time). Let’s assume that the 10 VLCCs hired by Saudi Arabia to be filled around the end of this month (we believe each can carry 2 million barrels) and shipped to the U.S. will assuage traders concerns about near-term supply. Let’s assume that the Obama administration is painfully aware of the political damage current and/or higher gasoline prices would create this year. Let’s assume that breaking the back of the rising energy price trend is the politically preferred option.
The point? We might believe that the energy price trend actually turned negative in March of 2011. We might believe that Brent crude and gasoline prices are going to decline through the second and third quarters this year. Yet… we have no clear idea how the bond market will respond to falling energy prices.
One could argue that declining energy prices will help cool inflationary pressure and allow the Fed to hold the funds rate near 0% for a longer period of time. In other words… weak oil prices mean rising bond prices.
One could also argue that rising energy prices are doing damage to the economic recovery so it is equally possible that bond prices could decline in lock-step with crude oil.
Our point here is that we really aren’t going to know how the bond market will react to energy price pressure until… we start to get energy price pressure.
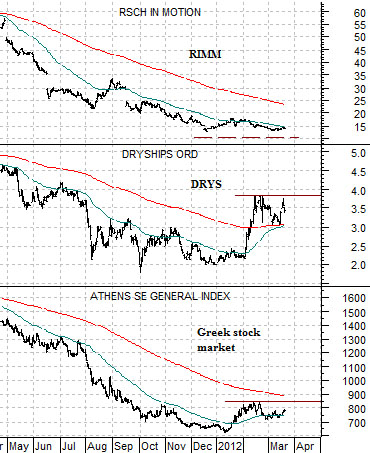
Below is a chart comparison between the Greek stock market (Athens Stock Exchange General Index), an ocean freight company (Dryships- DRYS), and RIMM.
The argument is that there were a number of sectors that were putting downward pressure on U.S. Treasury yields through the second half of last year. Greece, of course, along with the shippers and stocks like Research in Motion. Once the cyclical laggards finally started to make price bottoms it was much easier for long-term yields to swing back to the upside.
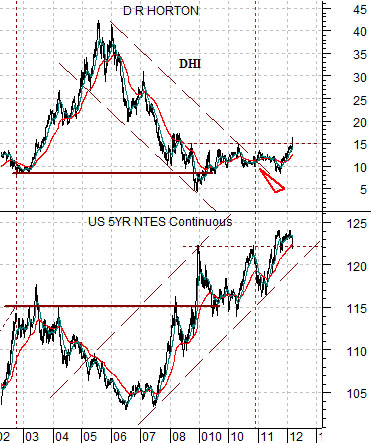
Last is a comparison between U.S. home builder DR Horton (DH) and 5-year U.S. T-Note futures.
So… home builders rising and bond prices falling. Home builders falling and bond prices rising. Simple. More or less.
The chart suggests that DHI pushed out of its bearish trading channel in late 2010 which should have marked the highs for 5-year T-Note prices. DHI slumped back towards the lows into the end of 2011 allowing bond prices to extend the rally.
The recent strength for DHI argues that the 5-year T-Note futures are stranded at uncomfortably high levels as ‘investors’ stretch for yield in response to the Fed’s statement that interest rates will be held near current levels through 2014. When the weakest sectors turn higher… we suspect that holding leveraged longer-term bond positions must feel somewhat uncomfortable.