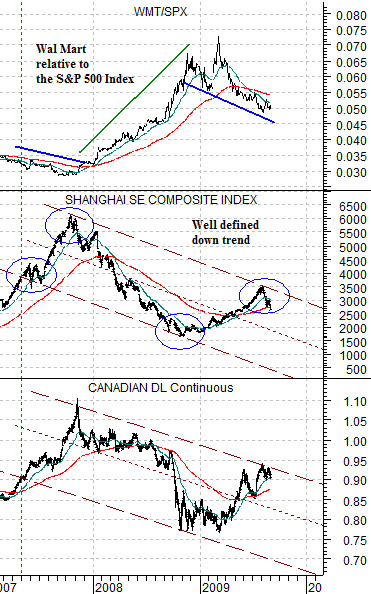
We are going to attempt to make a somewhat interesting point today. The argument begins with the chart of the Shanghai Composite Index at middle right.
When viewing a chart one can draw trend lines in any direction, from any starting point, and in a variety of slopes or angles. From our perspective a trend line becomes meaningful when it serves as part of a ‘channel’. In other words the two parallel lines that make up the channel have to be relevant on both sides of the market.
With this in mind we return to the Shanghai Comp. chart. If we draw a trend line down from the choppy action in the spring of 2007 through the lows in the autumn of 2008 and then add a parallel line down from the 2008 highs… we have literally defined the trend for China’s stock market over the past couple of years. In other words the trend for Chinese equities has been negative since the middle of 2007.
The trend for the Canadian dollar (CAD) futures is virtually identical to that of the Shanghai Comp. so one way to test out the channel is to extend it from the Shanghai Comp. to the Canadian dollar futures. Once again… the trend lines fit perfectly.
The chart below shows the ratio between Wal Mart (WMT) and the S&P 500 Index. The argument is that this ratio should rise when the Shanghai Comp. and Cdn dollar are falling and decline when these two markets are pushing higher. Fair enough.
The ‘somewhat interesting’ point is that there are typically two features that serve to define a trend- price and time. In a positive or bullish trend prices will rise over long periods of time and correct lower over shorter periods of time. In a negative or bearish trend prices will work lower over extended periods of time and rally sharply in quick counter-trend corrections.
If the channel for the Shanghai Comp. is correct then almost everything everyone thinks they know about the markets is actually wrong. Why? Because strength in the Shanghai Comp. and commodity-related Cdn dollar is actually a channel bottom to channel top correction within a negative trend with price weakness for Wal Mart serving as a bull market correction.
If we had used a longer-term time frame the conclusions would obviously have been different but our point was that as long as the Shanghai Comp. remains below 3500 and the Cdn dollar holds below roughly .9400 we can make the case that the trends are actually bearish, rallies are mere corrections, and that Wal Mart’s share price rising relative to the S&P 500 Index is, in fact, the offsetting or bullish trend.

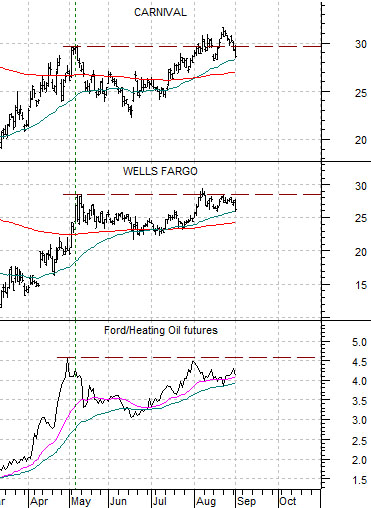
Below we have included a comparison between Carnival (CCL), Wells Fargo (WFC), and the ratio between Ford (F) and heat oil futures.
Cyclical weakness that includes falling energy prices can be a positive for the equity markets but only if the Ford/heating oil ratio rises. Our point may be that the equity markets will be stronger if equity prices are stronger- which means that we are taking an obvious and simple point and making it appear both inspired and complicated- but the issue is that if energy ‘users’ respond positively to lower energy costs the stock market will tend to rise. Such was not the case yesterday however.
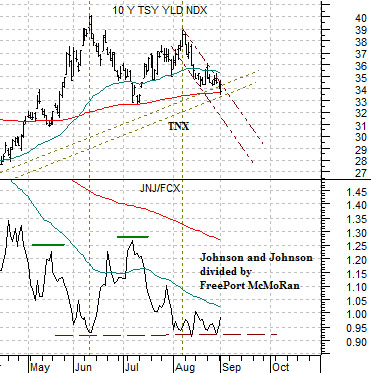
Below we compare 10-year Treasury yields (TNX) with the ratio between Johnson and Johnson (JNJ) and FreePort McMoRan (FCX).
At the end of last year’s second quarter JNJ was trading around 64 while FCX was close to 117. Today JNJ is just under 60 while FCX closed yesterday under 61. In other words JNJ has been mildly negative while FCX has lost close to half of its value.
The point through the second half of last year was that JNJ would outperform FCX- which it most certainly did- but the key for the broad stock market rested with whether JNJ could actually rise in price- which it most certainly did not. If Treasury yields continue to decline then we are back to the same issue- the JNJ/FCX ratio will rise as yields move lower but in order for the S&P 500 Index to hold or rise the share price of JNJ has to resolve upwards.
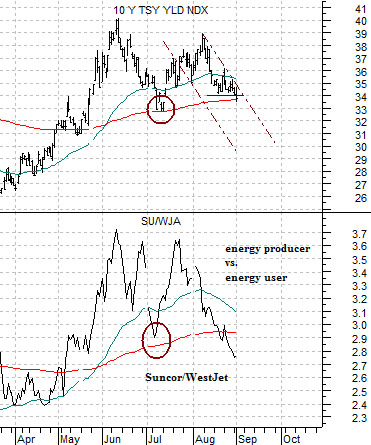
Below we compare 10-year Treasury yields with the ratio between Suncor (SU) and WestJet (WJA on Toronto).
When yields are rising SU is stronger than WJA and when yields are falling WJA is stronger. Fair enough. A bullish or positive equity markets outcome in the face of lower yields requires that energy users (WestJet and Ford) rise in price while a negative outcome similar to last year involves weakness in commodity producers (FreePort McMoRan and Suncor) AND weakness in the energy users.


