We are always amazed (and impressed) when the markets can go into a period of complete chaos only to stop at a precise point. To us this suggests that the sum of all decisions places an order over apparent randomness. Or something like that.
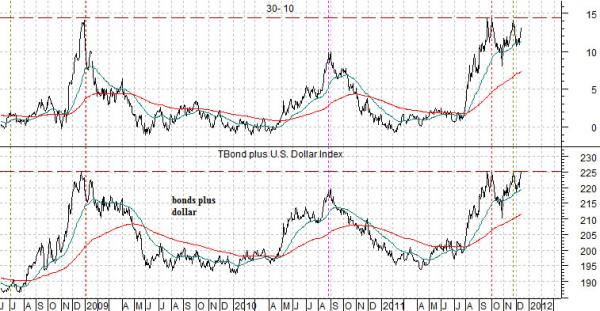
Below we have included a comparative chart of two markets combinations. The first is the 30-10 spread which is simply the price difference between the 30-year and 10-year Treasury futures. The second is the sum of the U.S. 30-year T-Bond futures added to the U.S. Dollar Index (DXY) futures.
The 30-10 spread rises and falls with bond prices. A rising bond market will push the spread higher as the 30-year TBond moves upward faster than the 10-year T-Note.
During periods of stress money tends to move towards both the dollar and the Treasury market so the sum of the TBond and DXY in recent years has been representative of ‘fear’. The higher the bond market and dollar the greater the movement of capital away from risk.
In any event… we have been following both the 30-10 spread and the sum of the TBond and DXY for quite some time. The argument was that at the peak for stress at the end of 2008 both of these markets combinations rose to peaks. As long as these peaks hold… there is a reasonable chance that conditions today are no worse than they were at the end of 2008. Fair enough. We hope.
At the end of trading on Wednesday (we noted this on page 5 of yesterday’s issue) the sum of the TBond and dollar rose to the same level as the end of 2008… for the fourth time since September. The 30-10 spread was a point or so lower but still close enough to the highs.
If the markets were going to dig in our view was that this was the exact point in terms of both time and price to do so. The key, in our opinion, was the action from the bond market with falling bond prices representing a somewhat calmer state and rising bond prices putting canned goods and ammunition into play as future investment choices.
At the end of the session the U.S. 30-year T-Bond futures were off 9/32 while the U.S. Dollar Index futures lost around .30.
Equity/Bond Markets
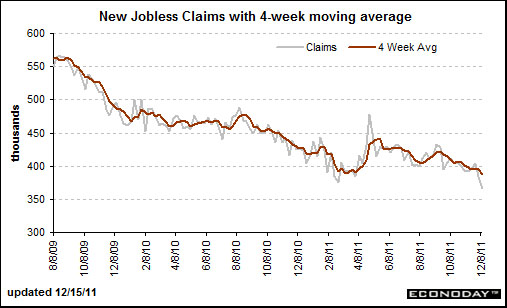
Econoday.com, December 15, 2011: Back to back declines of 19,000 in initial jobless claims are signaling sudden strength in the labor market. Claims in the December 10 week came in at 366,000, far below expectations for 390,000 and compared to 385,000 in the prior week (revised 4,000 higher). The 366,000 level is the lowest since May 2008. The four-week average is down 6,500 to 387,750 for the lowest level since July 2008. The average, in a convincing sign of strength, has been down in 10 of the last 12 weeks.
We have argued on many occasions that the markets are keying off of the weekly U.S. jobless claims report. The peak for claims in March of 2009 marked the low point for the equity markets.
So… how do the markets handle an incredibly bullish trend for U.S. employment at the same time that crisis is roiling through the Eurozone? The answer, apparently, is… not easily. At worst yesterday’s report helped to slow the descent for asset prices while at best it could serve as a launching pad for a rally through the end of the year.
Our view is that this was precisely what was needed at the exact time that it was necessary. Positive for equities, supportive of a stronger dollar, somewhat negative for energy and precious metals prices, and negative for bonds.
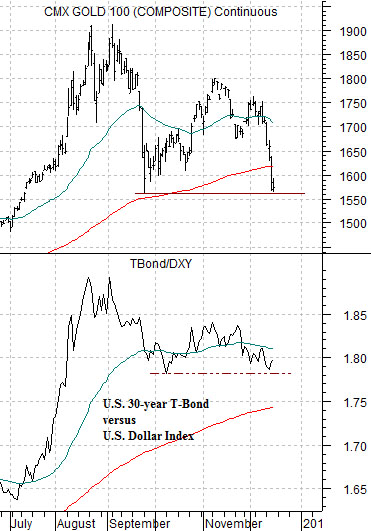
Below is our chart comparison between gold futures and the ratio between the price of the U.S. 30-year T-Bond futures and U.S. Dollar Index (DXY) futures.
Above we used the sum of the TBonds and dollar. On this page we are using the ratio.
The trend for gold tends to be very similar to the ratio between long-term Treasury prices and the dollar. Gold does better with a weaker dollar as well as with rising bond prices. When bond prices are rising and the dollar is falling… gold tends to rise inexorably in price.
The problem is that markets do not move in only one direction. Over time the dollar has tended to decline but every now and then it rises for a few years. The bond market has been higher in price for the past three decades even though it often goes through rather long periods of price weakness. If one combines a rising bond market with a weaker dollar the end result is… the current position of gold prices.
The point on this page yesterday was that if gold prices were going to put into some kind of stand the bounce in the TBond/dollar ratio would enough to explain and justify it. Our view, however, is that the dollar should remain flat to higher while bond prices move lower. When this is viewed within the context of the chart at right the end result is an expectation for a falling TBond/DXY ratio and a protracted price decline from current levels for gold. In due course.