P-Published: Thursday, March 9, 1989 -Japanese investment in United States real estate rose nearly a third last year, with California attracting more investment than any other state and Los Angeles more than any other city.
July 3 (Bloomberg) — Teck Resources Ltd., Canada’s largest diversified mining company, sold a 17 percent stake to China’s $200 billion sovereign wealth fund for C$1.74 billion ($1.5 billion) to reduce debt.
The comparison below may or may not be ‘fair’ but we thought we would run it just to show the other side of the trade. The ‘decade theme’ argues that we reach major asset price peaks around the start of a new decade following a period of crisis that begins in the ‘7’ year and extends through much of the ‘8’ year. If the ‘decade theme’ were to repeat the result would be a relentless push higher for one or more cyclical markets.
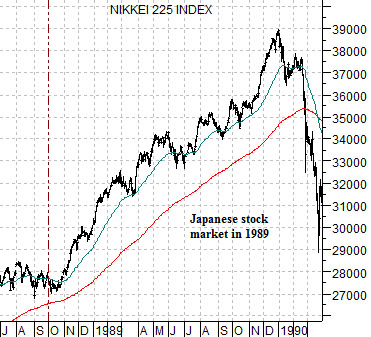
The announcement last week that China was buying a stake in Canada’s Teck Resources reminded us somewhat of the wave of Japanese buying of U.S. real estate through 1989. The chart at top right shows that the Nikkei 225 Index turned upwards in October of 1988 and continued to drive higher through all of 1989.
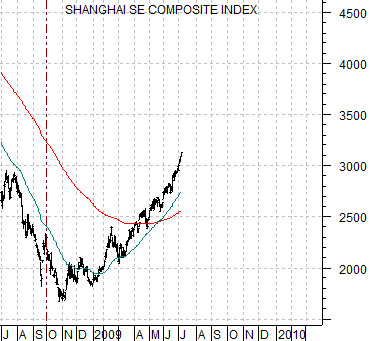
The point that we were attempting to make in yesterday’s issue was that the markets have reached yet another cross roads. Weakness in energy and metals prices along with ocean freight rates and the commodity currencies suggests that the markets are repeating the tendency to drive the commodity theme higher through the first half of the year before abandoning it and moving towards the non-commodity sectors. The problem so far has been that the market that has helped drive the commodity theme upwards- China- keeps making new highs.
The question that we were pondering was whether the strength of the China theme will be strong enough to push the entire commodity-related theme upwards through the second half of the year in a manner similar to Japan in 1989 or whether weakness in the commodity theme will serve to drag the Chinese stock market lower later this month. To date we have far more questions than answers however.
Equity/Bond Markets
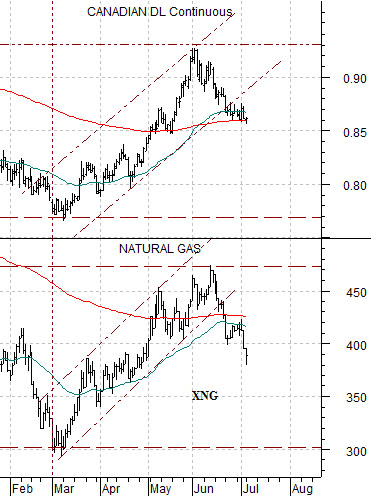
The chart below compares the Canadian dollar (CAD) futures with the Natural Gas Index (XNG).
A recurring argument has been that the trend for the Cdn dollar is very similar to that of the Natural Gas Index. To the extent that the ratio between the XNG and natural gas futures prices had tended to make major peaks around 90:1 and bottoms around 30:1 the push above to new all time highs in March on the way up to 120:1 suggested that either natural gas prices were far too low or the equity markets were pricing natural gas stocks at somewhat unrealistic levels. In other words… either natural gas prices were set to rebound sharply or the natural gas stocks were going to decline. Fair enough.
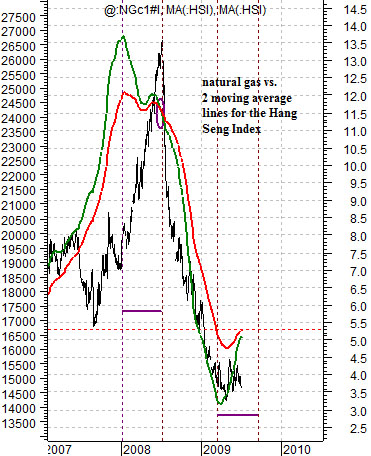
Strangely enough the whole ‘natural gas’ theme relates back to our first page argument with regard to the strength of the Chinese economy. While this is a difficult concept to explain and a harder one to toss into casual conversation… the idea is that there is a link or relationship between the trend for Hong Kong’s stock market and natural gas futures prices.
Below we feature an overlaid chart of natural gas futures (in black) and two moving average lines for the Hang Seng Index. The red line is the 200-day e.m.a. while the green line is the 100-day e.m.a.
The argument is that when the moving average lines ‘cross’ the base trend for natural gas reverses. The chart shows that the moving average lines crossed to the down side in July of last year concurrent with the peak for natural gas prices. The point, however, is that the longer the Hang Seng remains above roughly 16,500 the greater the upward pull on the somewhat quicker 100-day e.m.a. line. The longer the Chinese equity markets push upwards the better the odds that natural gas prices are ‘too low’.
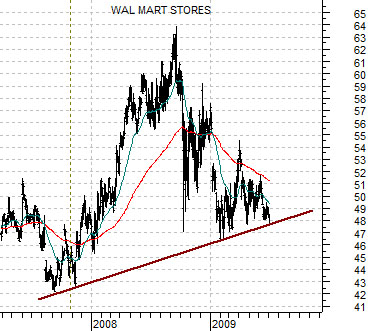
Below we show a chart of Wal Mart (WMT). WMT tends to trend inversely to the Asian growth theme and is currently sitting on what we view as support. If WMT is at a bottom then Asian growth can be at a peak. The point, however, is that as long as WMT continues to grind lower it is difficult to make a compelling argument in favor of slowing Asian growth.