Our focus today is on the potential for a sharp decline in the Chinese stock market. Not the certainty of a drop but merely the potential for downward pressure. Our sense is that Chinese asset prices have reached a major decision point so through today’s issue we will be showing how a number of relationships have finally clicked into place.
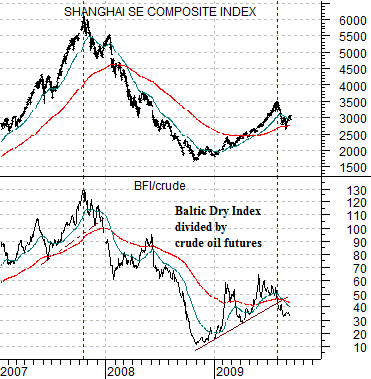
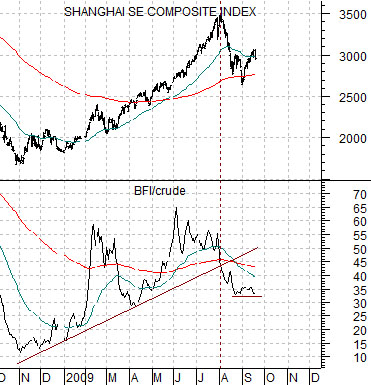
Below is a comparison between the Shanghai Composite Index and the ratio between the Baltic Dry Index (formerly called the Baltic Freight Index or BFI) and crude oil futures.
The BFI/crude oil ratio has tended to mirror the trend for the Shanghai Comp. The ratio declines when ocean freight rates for dry bulk cargo decline relative to crude oil futures prices. The point is that while energy prices in particular and commodity prices in general did not peak until the summer of 2008 the trend for the Chinese shares market turned lower some nine months earlier back in the autumn of 2007.
Below is a shorter-term view of this relationship. The idea is that similar to the fourth quarter of 2007 when the ratio between ocean freight rates to crude oil prices starts to decline in value it suggests downward pressure on Chinese stock prices.
We started off this page by stressing the word ‘potential’ with regard to lower Chinese stock prices. If the peak for the BFI/crude oil ratio marked the highs for the Shanghai Comp. in 2007 and the lows for the ratio were made as the Shanghai Comp. reached bottom at the start of November last year then we can write with some conviction that pressures exist even if the ultimate outcome has yet to be decided.
The point that we are circling is that the ratio between the Baltic Dry Index and crude oil futures has fallen by close to 50% since the early June peak suggesting a fairly serious deterioration in the trade-related fundamentals that led to a doubling of the Shanghai Comp. from November through July. We can see that the BFI/crude oil ratio has been under pressure and we can also see on the chart at right that the Shanghai Comp. has worked through what we tend to call a ‘crash top’. What is missing- at time of writing- is a resolution because lower levels for Chinese share prices likely requires a series of lower readings for the freight rates/crude oil ratio.
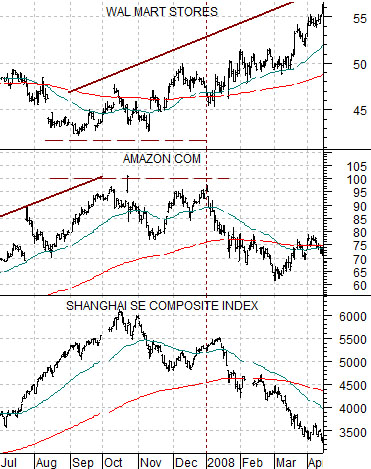
Below we compare the share price of Wal Mart (WMT), Amazon.com (AMZN), and the Shanghai Composite Index. The chart covers the time frame from July of 2007 through into April of 2008.
The idea is that the Shanghai Comp. made two price peaks in 2007 and 2008. The first was made in November with the second reached in early January of 2008.
Our focus is on what was happening to AMZN and WMT at these two points in time.
AMZN reached a cycle peak in October and then returned to the highs in January. Meanwhile the share price of WMT had started to slowly trend upwards.
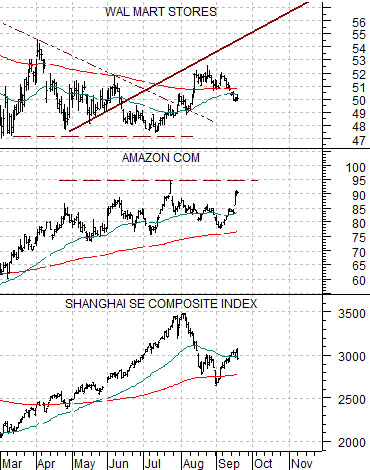
Below we have included the same chart for the current time period. The argument is that AMZN represents in some way, shape, or form the same trend that is driving the Shanghai Comp. On the other hand WMT represents the inverse of that trend. If the Shanghai Comp. were working through a ‘top’ then what we would expect to see is AMZN at a price peak and WMT starting to lift.
So… if a cycle peak for the Shanghai Comp. should include a peak for the Baltic Dry Index/crude oil ratio and the share price of Amazon and if the markets followed the same script as the autumn of 2007 then the share price of WMT would push up above its 200-day moving average line and then back down to just below it (January 2008 and the present situation) then we can at least argue that a variety of conditions have now been met.
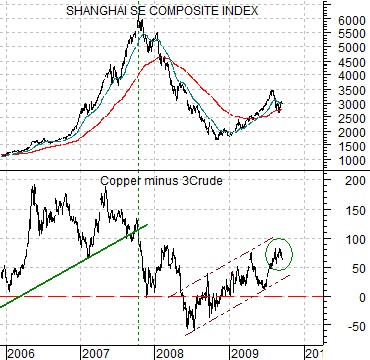
Below we compare the Shanghai Comp. with the spread or difference between copper futures (in cents) minus crude oil futures (in dollars time three). We have argued in the past that Asian economic strength tends to go with stronger copper prices. We have also suggested that over time the spread should swing back and forth through the ‘0’ line with periods above the line indicating Asian cyclical strength and periods below the line marking Asian cyclical weakness.
