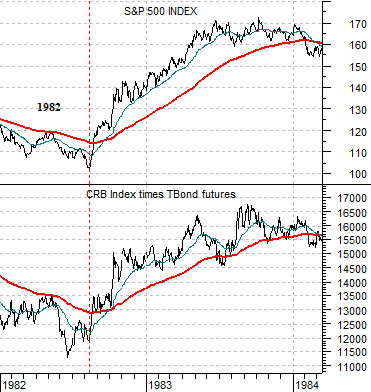
We are going to check in with a relationship that we focused on back in 2009. At right is a comparison between the S&P 500 Index (SPX) and the combination of the CRB Index (commodity prices) and U.S. 30-year T-Bond futures (bond prices) from 1982 into 1984.
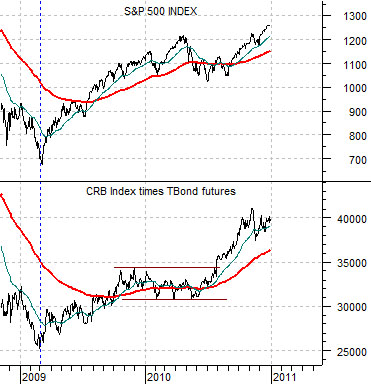
We argued back in 2009 that the trend for the SPX should be similar to the combination of commodity and bond prices. Below is a chart of the current situation.
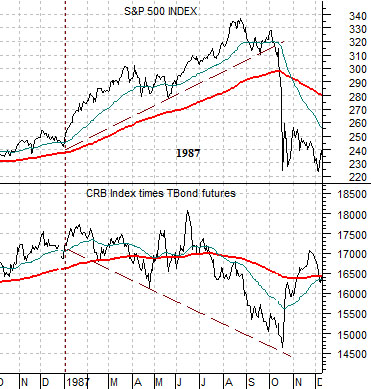
The point is that from this perspective the basic trend for the equity markets remains positive. This may change, of course, as we enter 2011 but for now conditions remain constructive. Contrast this with the divergence that was created prior to the stock market ‘crash’ in 1987 (chart below). Through the third quarter of 1987 bond and commodity prices declined even as the SPX drove to new highs. Eventually, of course, the divergence was closed as the equity markets collapsed. This is most certainly not the case at present which, we suspect, is somewhat comforting as we close the books on another year.
Equity/Bond Markets
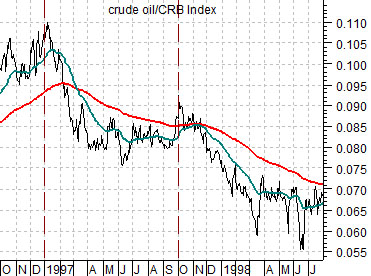
Our focus over the past while has been on the way the crude oil/CRB Index has declined even as the cyclical trend has remained positive. We are going to (hopefully) take one last run at this topic.
Below are three charts of the crude oil/CRB Index. The top chart is from 1996- 98. It shows that the ratio declined for around 9 months through September of 1997. As the Hang Seng Index broke lower that autumn the ratio resumed its decline. This served as a positive for the energy ‘user’ sectors until the flight of capital away from Asia created a crisis during the third quarter of 1998.
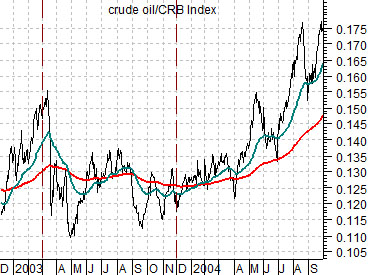
At middle is a chart of the crude oil/CRB Index ratio from 2003- 2004. In this instance the ratio declined for 9 months before swinging back to the upside into 2004. This marked the start of upward pressure on short-term interest rates that would lead to the first hike in the Fed funds rate in mid-2004. A number of trends that dominated the markets from 2000 into 2004 peaked as this ratio swung higher.
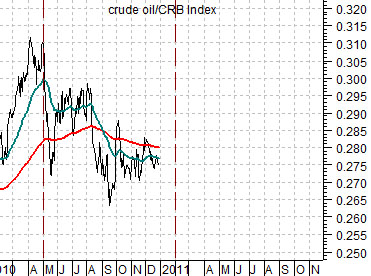
Below is the current situation. The ratio topped out in April of 2010 and will have been negative for 9 months as we push into 2011. If it swings upwards then look for crude oil prices to move to triple-digits. If it resolves lower then we will have less pressure on short-term yields and likely a better trend for the non-commodity stocks.
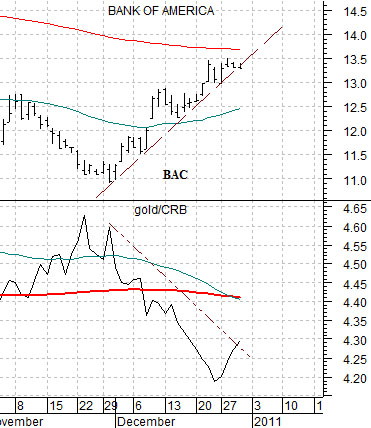
Lastly is a chart that we have been following for the past while in the back pages. The chart compares the trend for Bank of America (BAC) with the ratio between gold and the CRB Index.
The chart suggests that as BAC approached resistance at its 200-day e.m.a. line the markets began to shift somewhat back towards gold. It may take a bit of time, a new quarter, and something above 13.50 for BAC to turn the trend for gold prices lower once again.