Around the start of 2010 we commented that we expected the equity markets to start the year off strong and end it weak.
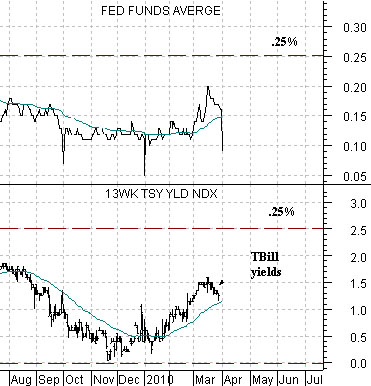
In past issues we have argued that cyclical growth has tended to push interest rates higher through the first half of the year and then pull them lower through the second half.
On quite a number of occasions we have shown how the ratio of copper prices to gold prices trends with long-term Treasury yields. Rising yields go with copper price strength while falling yields tend to favor gold.
The point? If we cobble together these three thoughts we end up with an intriguing thesis.
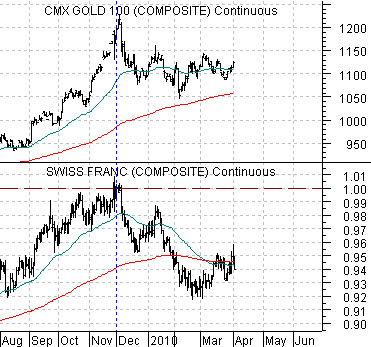
Below is a chart comparison between gold futures and the Swiss franc futures.
The argument is that gold trends with the franc. Through the second half of 2009 the franc pushed relentlessly up towards parity with the dollar until this level was finally reached around the end of November. Once the franc closed above dollar parity the price of gold reached a top.
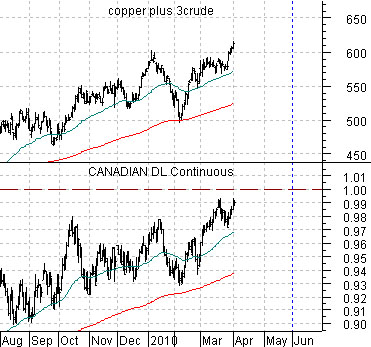
Below is a comparison between the Canadian dollar (CAD) futures and the sum of copper and crude oil futures.
Every time the CAD weakens it steadies out and pushes back towards parity with the U.S. currency. Each time the CAD rises it pushes copper and crude oil prices upwards. The thought is that the strong cyclical trend involving rising yields, base metals prices, and energy prices is not going to end until the trend for the Cdn dollar turns negative and that may not happen until this currency manages to cross back above 1.00 with respect to the U.S. dollar.
Our view is that the trend for gold turned negative once the franc reached a high last November and that the trend for energy and base metals will turn negative later this quarter once the commodity currencies begin to weaken. A positive trend for copper combined with a negative trend for gold results in a rising trend for interest rates. Since the equity markets are moving upwards as the cyclical recovery strengthens the longer the trend for the Cdn currency remains positive the longer the rally should extend for the equity markets.
The chart below compares the U.S. Dollar Index (DXY) futures with the ratio between the share price of Amgen (AMGN) and the S&P 500 Index (SPX).
On the one hand… the U.S. dollar is trending higher. On the other hand… the equity markets are still arguing that the trend is focused on euro weakness. While this may appear like a thesis-justifying splitting of hairs (and it might well be) the argument is that between the peak in the euro (along with the Swiss franc, British pound, and gold) and the top for the Canadian and Australian dollars (along with copper and crude oil) the markets will be somewhat ‘in between’ with respect to the dollar.
Below we compare the DXY futures with the ratio between the Philadelphia Semiconductor Index (SOX) and copper futures.
A ‘strong dollar’ trend should include a rising AMGN/SPX ratio and a rising SOX/copper ratio. Both ratios are no better than flat since the dollar turned higher in November. From this perspective the dollar isn’t strong and it isn’t weak. It is stronger against Europe and weaker against the commodity currencies. It is strong enough to cap the rising trend for gold prices but not strong enough to turn the trend for copper and crude oil prices lower.
The issue becomes a bit more murky when we view the chart below of the share price of Wal Mart (WMT) and the ratio between Hong Kong’s Hang Seng Index and the S&P 500 Index.
When the Asian theme turns negative then WMT tends to swing higher as the Hang Seng/SPX ratio begins to decline. While the Treasury’s decision to hold off on labelling China a ‘currency manipulator’ for a few months might reignite the rising trend for Hong Kong share prices… through the end of last week the trend for the Hang Seng/SPX ratio was still lower and when it is lower it typically means that the dollar has swung into a rising trend.