April 5 (Bloomberg) — Canada’s dollar rose to the highest level since it last traded on a one-for-one basis with its U.S. counterpart in July 2008 as crude oil rose above $86 a barrel, bolstering the appeal of commodity-linked currencies.
Over the past few days we have focused on the push towards parity by the Canadian dollar. The argument was that once any market gets close enough to a ‘big round number’ the trend usually continues until that number has been reached. Of course the rally by the Swiss franc late last year to parity marked not only the highs for this currency but also the top for gold prices while the closely watched rally to 5000 by the Nasdaq back in 2000 actually set the peak for the equity markets.
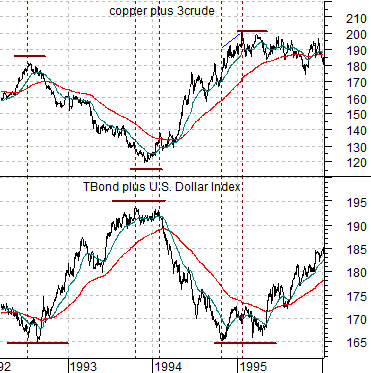
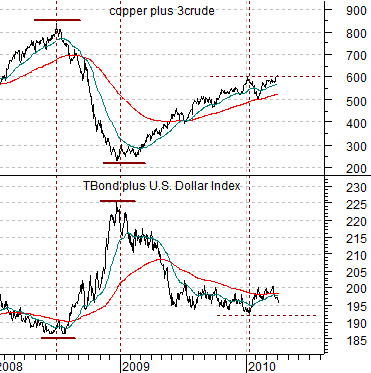
With the commodity currencies pushing higher along with commodity prices as bonds move lower we thought we would take a rather large step backwards in search of some kind of perspective today. At right are two chart comparisons between the sum of copper (in cents) and crude oil (in dollars times three) and the sum of the U.S. 30-year T-Bond futures and U.S. Dollar Index (DXY).
The argument is that copper and crude oil are on one side of the equation while the dollar and bond market is on the other. Strong energy and metals prices tend to go with dollar weakness and rising interest rates while falling energy prices and metals prices typically occur when the dollar is stronger and interest rates are falling.
The chart below shows the time frame between 1992 and the end of 1995. Notice how the lows for the TBonds and DXY in 1992 and 1995 set the highs for commodity prices.
The next chart below is from the current time period. The bottom for the dollar and bond market in 2008 marked the cycle peak for copper and crude oil futures prices.
The point? The sum of the TBonds and Dollar Index hit bottom back in January. With crude oil and copper streaking to new highs this week the situation is somewhat similar to late 1994. In that instance the bond market and dollar reached a bottom in October even as copper and crude oil prices pushed to a high into January of 1995. Our sense is that commodity price strength will be limited in terms of ‘time’ as long as the dollar and bond market hold above the lows set earlier this year.
Equity/Bond Markets
We did the ‘dollar and bond market’ combination on page 1 as a set up for the chart at right. When we compare the dollar and bond market to the sum of copper and crude oil we add copper in cents to three times the price of crude oil in dollars.
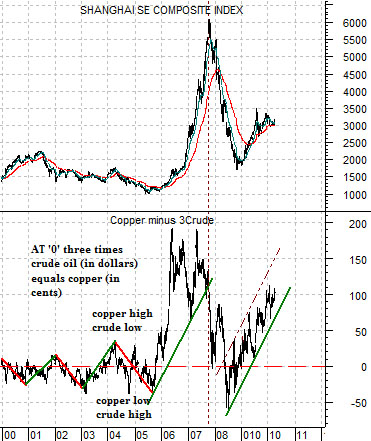
Below is a chart comparison between the Shanghai Composite Index and the spread or difference between copper (in cents) and crude oil (in dollars times three).
The argument is that while copper is rarely exactly three times the price of crude oil over time this spread tends to swing back and forth through the ’0’ line. When copper is stronger than crude oil it tends to reflect strong Asian or BRIC-type growth and when the spread falls back below the ‘0’ line the opposite tends to be true.
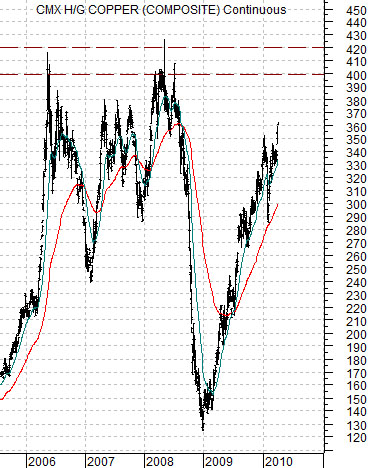
So… in a sense one might argue that crude oil prices between 85 and 90 are ‘high’ but actually they are not… as long as copper prices are close to 360.
Below is a chart of copper futures. Between 2006 and 2008 copper prices kept hammering back up to or above 4.00 which, in terms of our ratio, suggests that crude oil prices could rise to 130- 140. As crude oil accelerated to the upside in the autumn of 2007 the copper minus 3crude oil spread began to decline which marked the end of the rally for the Shanghai Comp. and Hang Seng indices.
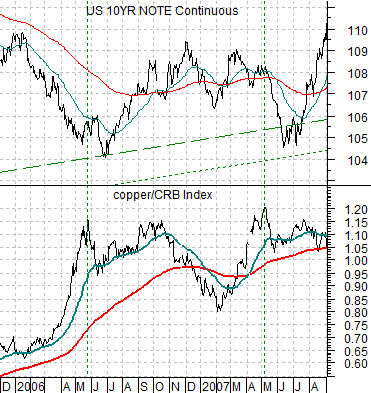
At bottom we show the ratio between copper and the CRB Index and 10-year T-Note futures. Typically the bond market weakens as the copper/CRB Index ratio rises. The chart on page 7 makes the case that the TNote futures could decline all the way back into the 109- 110 range which would push 10-year yields up to 4.5%. Our point yesterday was that if 10-year yields move appreciably above 4.0% the concurrent rise in short-term yields should lead to a hike in the Fed funds rate at the next meeting.
