We are not sure whether we have done this before in a previous issue but our intent today is to show how the two lagged relationships that we have been discussing fit into a rather neat package. While coherence and simplicity are hardly our long suits… we begin with a rather rare sense of optimism.
The two lagged relationships are the 2-year lag and the 9-month lag.
The 2-year lag is based on the premise that abrupt changes in monetary policy take some time to work through the markets. When the Fed begins to ease credit, for example, the equity and commodity markets do not turn higher for a considerable length of time. Conversely when the Fed wades in to restrict credit there is typically a period of time when analysts argue that the Fed’s efforts are no longer effective.
Two recent examples come to mind. The Fed started to cut the funds rate in January of 2001. If there was not a lag between changes in yields and cyclical growth the equity markets wouldn’t have declined for the next two years. On the other hand when the Fed finally began to raise the funds rate in mid-2004 we didn’t see a true break in the cyclical trend until copper prices finally stopped rising in 2006.
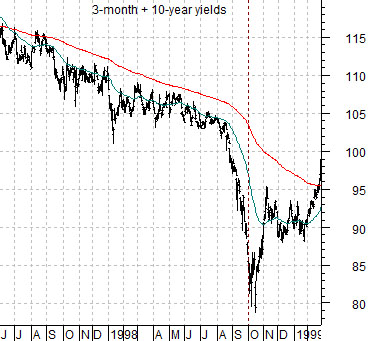
Immediately below is a chart of the sum of 3-month and 10-year yields from 1997 into early 1999.
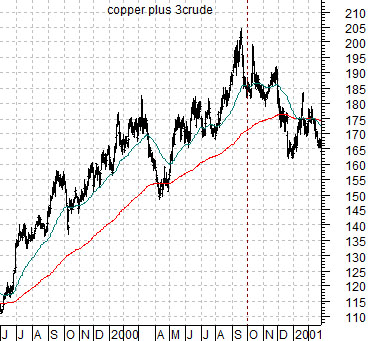
Next we show the sum of copper and crude oil futures starting in 1999 and running into early 2001.
The argument is that the cyclical trend lags changes in yields by two years. Obviously ‘two years’ is rather specific but, more or less, it seems be fairly accurate.
The low point for yields was reached around the start of the fourth quarter in 1998 following the Asian crisis that roiled the markets during the late summer. The 2-year lag argued at the time that while yields were falling in 1998 in response to cyclical weakness this would lead into a strong cyclical recovery that would create a peak in one or more cyclical asset markets around the start of the fourth quarter in 2000.
To the extent that the sum of copper and crude oil reached a high almost exactly two years AFTER the sum of short and long-term Treasury yields reached a low… we will suggest that a lag of close to two years may exist.
Equity/Bond Markets
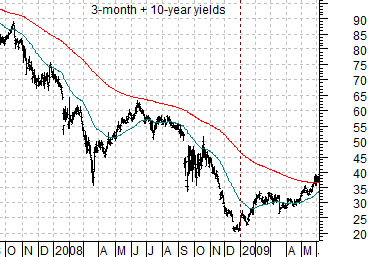
Below is a chart of the sum of 3-month and 10-year Treasury yields from 2007 into 2009.
The point is that the low point for yields was reached at the end of 2008. The 2-year lag suggests that a peak for cyclical asset prices should be due around the end of this year. Fair enough.
The second relationship is the 9-month lag. The 9-month lag is based on the idea that cycles tend to ‘overlap’. In other words weakness begins to show up well before the strongest sectors reach a peak.
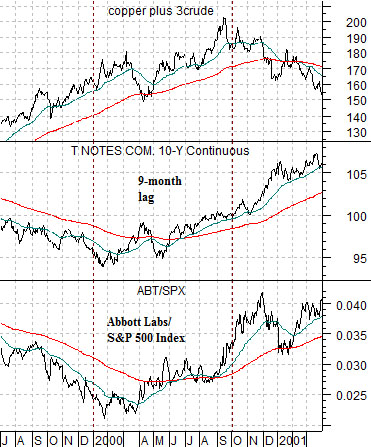
The chart below compares the sum of copper and crude oil, 10-year T-Note futures, and the ratio between Abbott Labs (ABT) and the S&P 500 Index (SPX) from mid-1999 into 2001.
Copper and crude oil peaked around the start of the fourth quarter of 2000. This marked the ‘end’ of the cyclical rally.
Bond prices, on the other hand, began to rise around the start of the first quarter of that year. This marked the ‘start’ of cyclical weakness. The 9-month lag argues that between the start of weakness and the end of strength about 9 months elapses. This explains why the bond market was rising in price along with the ABT/SPX ratio even as copper and crude oil prices pushed to new highs. The bond market was the leading edge of weakness while energy and metals prices represented the trailing edge of strength.
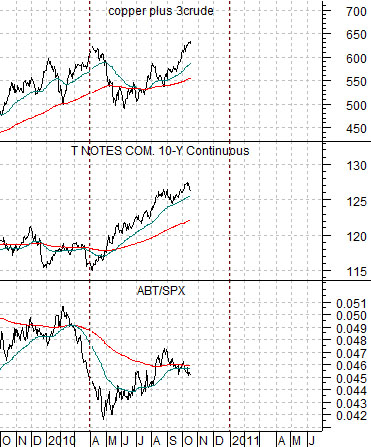
Lastly we show the same chart comparison starting in October of 2009.
If we ‘reverse engineered’ the market’s trend (and we really should have done this months ago) then much of what has happened so far makes sense. The 2-year lag argues for cyclical strength into the end of 2010 while the 9-month lag argues that weakness should start to show up around the end of the first quarter.
The chart shows that 9 months ahead of the expected peak in cyclical strength… the bond market turned higher and that this trend was confirmed- so far- by a rising ABT/SPX ratio. In other words the markets are following a similar path to 2000 with the only significant difference being that we are looking for a cyclical peak at the end of the fourth quarter this time around.