In yesterday’s issue we commented that the trend for bond prices and yields remains something of a mystery. We can make a reasonable case for falling yields based on the output gap and an equally reasonable case for rising yields due in large part to the huge surge in Chinese bank lending. One outcome points to an equity market recovery similar in some ways to 1982 with the interest rate sensitive and defensive sectors leading to the upside while the other argues for something a bit more like 1999 following the Asian financial crisis and leading into the Nasdaq’s bubble peak.
The argument yesterday was that if the markets follow a post-commodity price peak and recession bottom path similar to 1982 then the start of an equity markets surge would line up with some sort of break out to the upside for long-term Treasuries. In other words if the bond market is leading the recovery as financial asset prices rise as an offset to weakness in real asset prices then the catalyst for stronger equity market prices would come from a trend line or price break to the upside by the long end of the Treasury market. Fair enough.
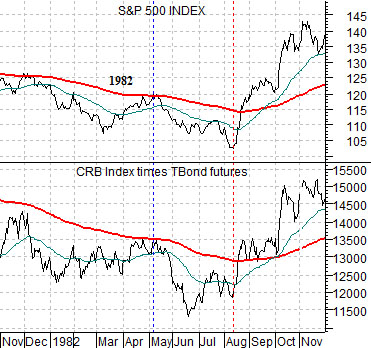
There was another detail from the 1982 experience that we thought we should add to the mix today. At top right we compare the S&P 500 Index (SPX) with the product of the CRB Index times the U.S. 30-year T-Bond futures from late 1981 through November of 1982.
Two things happened towards the end of the summer in 1982. The bond market began to rise in price on the way to a push to new highs and the commodity markets reached a correction bottom and began to flatten out. To the extent that the broad equity market is part ‘financial’ and trades with the bond market and part ‘growth’ which links it to the commodity markets the key, we suspect, to the upside pivot in August of 1982 came not only from rising bond prices but also from the end of downward pressure on the commodity markets.
The point is that as long as the CRB Index times TBonds combination remained below its 200-day e.m.a. line either through flat bond prices or declining commodity prices the SPX was unable to kick above its moving average line and into a positive rising trend. The current markets face a similar problem- as shown at bottom right- with the SPX stalling at its moving average line. A better bond market and/or a much stronger commodity market will likely be needed to swing the longer-term trend back to positive.

Equity/Bond Markets
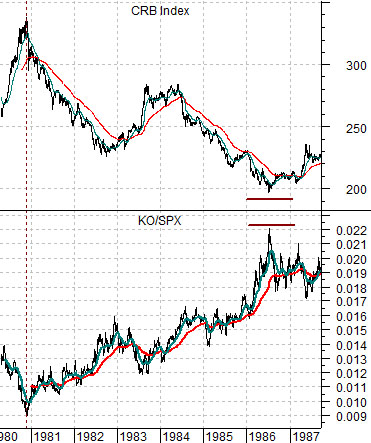
Below we compare the CRB Index to the ratio between the share price of Coca Cola (KO) and the S&P 500 Index (SPX) from 1980 into 1987.
The argument is that when the KO/SPX ratio begins to rise it marks the start of commodity price weakness. The second point would be that while commodity prices reached a bottom in 1982- as mentioned on page 1 today- it was most certainly not THE bottom. The CRB Index rallied from 1982 into 1984 before turning lower through into 1986. The 1987 stock market ‘crash’ was, by and large, a result of the stresses created on the system following the turn higher by the commodity markets in 1986.
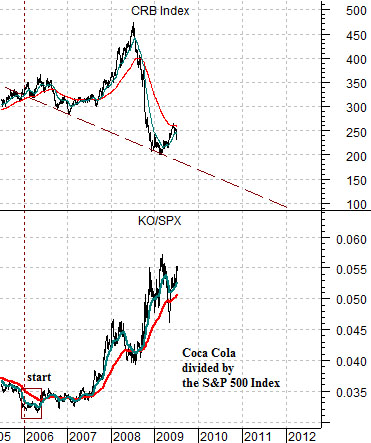
In any event… if we use the KO/SPX ratio to fix the peak for the CRB Index we find that the trend turned negative way back in 2006. As long as the KO/SPX ratio is making new highs- and it has been doing so on occasion for the past few years- the trend for the CRB Index is actually lower.
The point, we suppose, might be that the markets are somewhat of a ‘dog’s breakfast’ these days. On the one hand almost no one would argue with the assertion that the trend was being driven into 2008 by strong commodity prices while on the other hand… we can show that the trend for commodity prices actually turned negative two years previous. With the KO/SPX ratio close to new highs today we can argue that downward pressure on the CRB Index continues even as many believe that the commodity markets are leading the recovery.
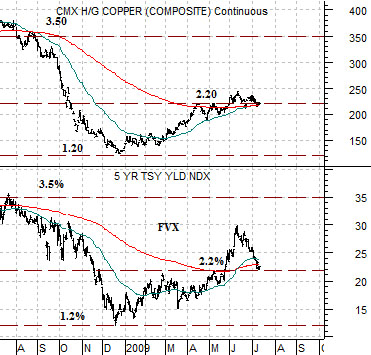
In any event… aside from the fact that the markets have become a bit more complex and confusing than usual… we will move on to the next topic. Below we show copper futures and the yield index for 5-year U.S. Treasuries.
The argument is that the price of copper and the 5-year yield have been somewhat similar with copper close to 3.50 last year when yields were around 3.5% and copper down to 1.20 when yields fell to 1.2%. After breaking up above 2.2% in late May as copper futures rose above 2.20 the 5-year yield has cooled somewhat. A return to higher yields would go with Asian growth and stronger copper while a break below 2.2% would argue for Asian economic weakness and lower copper prices.