July 29 (Bloomberg) — U.S. stocks fell for a second day as plunging Chinese shares and commodities stoked speculation that the surge in equities has outpaced the economy.
July 29 (Bloomberg) — Treasury notes fell after a government auction of a record amount of notes drew higher-than- forecast yields for a second consecutive day, renewing concern a deluge of U.S. debt will overwhelm investor demand.
It is never easy. Our recent argument has been that the dollar and bond market would resolve higher as the cyclical theme- powered by Asian equity markets and commodity prices- turned negative. Our thesis held in quite nicely yesterday although we could have done without the sell off in the bond market.
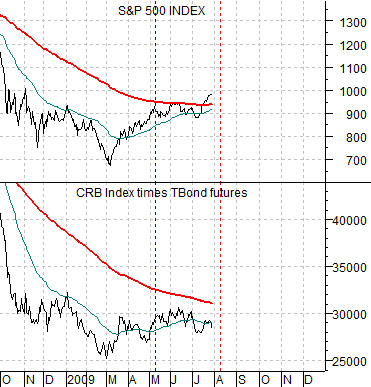
Below we compare the S&P 500 Index (SPX) and the combination of commodity prices (CRB Index) times the U.S. 30-year T-Bond futures through the bear market bottom in 1982. Below right we feature the same comparison for the current time frame.
Once can argue- and we have, actually- that the equity markets are so geared to asset price strength that they only seem to rise when long-term bond prices are falling. In other words… for all intents and purposes each time the bond market begins to rise in price the stock market stumbles.
To an extent this has been true but we have also argued that falling interest rates are always a positive for equities; the negative is not falling yields but rather the reason yields are falling.
In any event in 1982 the U.S. equity market did not successfully push above its 200-day e.m.a. line until the combination of bond and commodity prices finally began to lift. Our thought is that as long as the bond market is acting hamstrung by new supply and the commodity markets are trading lower in response to a rising dollar… it is difficult to get overly excited about the recent upside break through the moving average line by the S&P 500 Index. Our expectation was that the next bottom for the SPX would be made around the second week of August and although it has been stressful holding this view as the SPX has pushed upwards… we are going to hold to this view for the time being.

Equity/Bond Markets
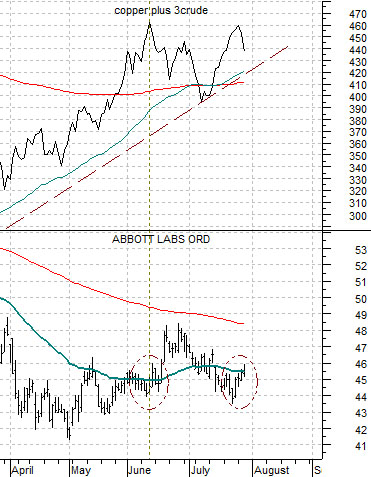
Below is a chart of the share price of Abbott Labs (ABT) and the combination of copper futures prices (in cents) plus crude oil futures (in dollars times three).
We have argued on a few occasions that Abbott Labs has shown a tendency to press lower through strong cyclical trends. One way that you can get a sense of the end of a strong cyclical trend is through corresponding strength in ABT’s share price. Our specific observation was that when ABT moved above its 50-day e.m.a. (blue-green line on the chart at right) the sum of copper and crude oil should be ready to turn lower.
To keep us from enjoying life even for a few days the markets muddied the landscape through much of July by capping the rally in ABT that developed in June and pressuring the share price lower through the earnings reporting season. After breaking above the moving average line in June right at the peak for the sum of copper and crude oil prices ABT moved back below its line as the commodity markets retested the highs. Fair enough. Through trading yesterday it appeared very much as if the markets were set to make a second and hopefully final pivot.
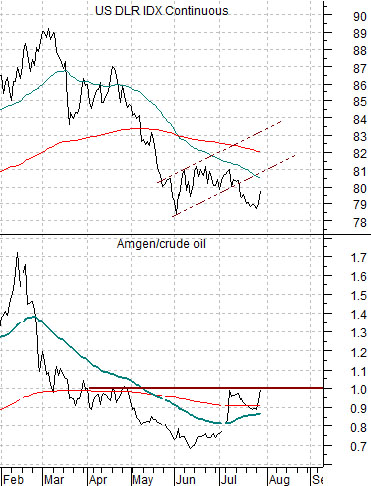
We use the share price of Amgen (AMGN) for much of our work regarding the U.S. dollar. We have created arcane ratios like Amgen divided by the Baltic Dry Index and Amgen divided by crude oil futures to get a sense of the dollar’s trend. The chart below right suggests that if the AMGN/crude oil ratio rises nicely above 1:1 (i.e. Amgen’s share price rising above the near futures contract price for crude oil) the dollar should be better. Since 1:1 is a fairly straightforward relationship we thought we should mention it today.
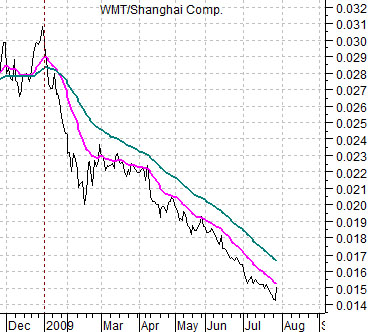
Another strange relationship that we mention quite often has to do with Asian share markets and the price of Wal Mart (WMT). WMT tends to turn higher when the Asian/commodity theme turns negative so we put together a ratio chart of Wal Mart divided by the Shanghai Composite Index. If the ratio is falling it means that the Asian theme is dominating and if the ratio turns higher then we have reached a trend change point that should run for quarters if not years. Even we would be hard pressed to call yesterday’s action much more than a minor correction.