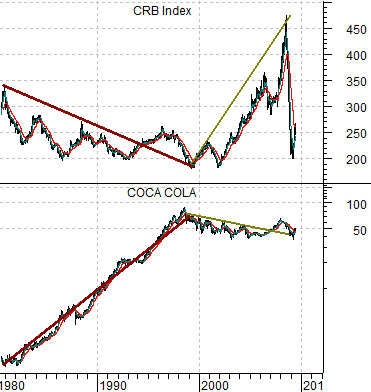
We are going to get ‘macro’ once again today. At right we show a chart comparison between the CRB Index (commodity prices) and the share price of Coca Cola (KO). Coke has been scaled in semi-log.
Following the commodity bull market of the 1970’s the trend shifted in the early 1980’s away from inflation. From roughly 1980 through into 1998- 99 the share price of Coke rose at very close to a constant and compounding rate.
The point is that once the trend for commodity prices turned lower the offset was a protracted positive trend for large cap consumer-type stocks.
The peak for Coke towards the end of the 1990’s ushered in the start of a new bull market phase for commodity prices. As Coke’s share price traded flat to lower the trend for the CRB Index was strongly positive culminating in a peak last year. Fair enough.
Our argument was that a commodity price peak concurrent with a major recession would mark the end of the rising commodity price trend and a return to better relative performance by the kind of large cap consumer and pharma names that had languished over the past decade. We got the commodity price peak correct- eventually- but were somewhat surprised that instead of rising in the face of commodity price weakness the broad stock market simply collapsed.
The point is that we can understand Coke trading weaker in a strong commodity price trend and we can understand Coke rising once commodity prices reach a peak and move into a lengthy period of consolidation. What we are having trouble processing is both sides of the equation trending lower at the same time.
Below right we feature the ratio between equities (SPX) and commodities (CRB) along with the cross rate between the Japanese yen and euro.
The equity/commodity ratio rose with the share price of Coke from the early 1980’s through the 1990’s before turning lower around the same time that the yen began to weaken against the euro. IF the base trend still favors commodity prices over equities then it makes sense that the markets can suffer when the yen begins to strengthen against the euro. If, on the other hand, the recent action has merely marked the transition from a commodity price-driven trend back towards an equity driven trend then yen strength would necessarily represent a positive.
Equity/Bond Markets
To finish off our first page point… our expectation was that the peak for commodity prices would shift the trend back in favor of equities and lead to a return to a rising trend for U.S. large cap equities. There is nothing overly odd about the fact that both equities and commodities have been weaker because that is what happens during recessions. The argument, however, is that one of the two should be ready to push to new highs as we push on through 2010.
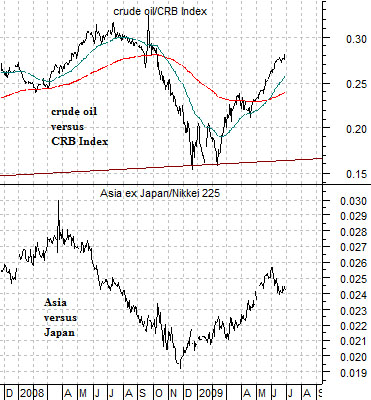
At right we show the ratio between crude oil futures and the CRB Index (crude oil relative to general commodity prices) and the ratio of the Asia ex-Japan Index divided by Japan’s Nikkei 225 Index.
The argument is that when Asia ex-Japan is stronger than Japan it tends to go with crude oil price strength. Since it was our contention that oil prices made a cycle price peak last year we have tended to favor Japan over the rest of Asia. Not our finest moment, of course, but that doesn’t mean that the argument is not valid.
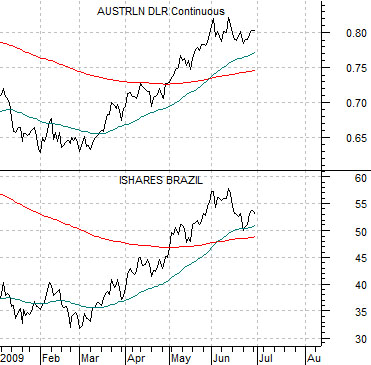
Below we compare the Australian dollar (AUD) futures with the Brazilian i-shares (EWZ). The basic point is that during a commodity price-driven trend the Aussie dollar will tend to rise while money pushes towards the markets of commodity producers such as Brazil.
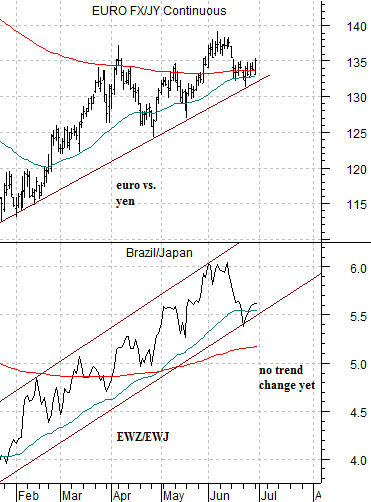
With that in mind we skip down to the chart at bottom right of the cross rate between the euro and the yen (we showed the reciprocal of this on page one through the yen/euro cross) and the ratio between the Brazil etf and the Japan etf (EWZ/EWJ).
The simple point is that the euro is rising against the yen concurrent with a rising commodity price trend and this trend goes with strength in the commodity currencies (Aussie, Cdn, and New Zealand dollars) and with relative strength by Brazil compared to Japan. The U.S. and Japan are part of the commodity ‘user’ theme while Brazil etc. trend as commodity ‘producers’. In any event… the Brazil/Japan ratio and the euro/yen cross rate are still rising which suggests that through the first half of 2009 the trend was focused on rising commodity prices.