As simply as possible… we are currently in a commodity markets price crash. At least that would be the tweeter-sized explanation.
The problem with carry trades is that eventually the flow of money slows and then reverses catching all of those who have forgotten that the markets often trade in boom-bust cycles instead of straight-line trends. After years of pushing money out of dollars and into foreign/emerging/Asian/Latin themes focused on base metals and then precious metals and then even rare earths… money is coming home to the dollar. Quickly.
First up is a chart of the S&P 500 Index from 1987. This shows ‘the crash’ that occurred in October of that year. Obviously this is a rather extreme comparison but we thought it might make sense to at least consider the near-term worst case.
Next is a chart of copper futures from 2011. Notice the similarities between this chart and the equity markets in 1987?
We have no idea whether we are going to see 3.00 or 2.50 copper into the end of the quarter but our sense is that eventually the markets will start to discriminate between what leads and what lags and what is hurt by this compared to sectors that benefit.
For months we have shown comparisons based on the divergence between oil stocks and oil prices as well as gold stocks and gold prices as we made the case that the equity markets were ‘saying’ that commodity prices were too high. If equities lead- which, we will argue, they do- then there should come a point where the stock prices of the commodity producers stop selling off in response to the very weakness that they had forecast.
In due course large investors will stop selling bushel loads of portfolio-hedging equity index futures. As the frenetic pace slows some will even begin to consider that if the producers of commodities are now worse off perhaps the consumers of raw materials are now in better shape.


Equity/Bond Markets
At present the dollar and the bond market are rising.
When the dollar and the bond market are rising the consumer defensive stocks show relative strength. If the dollar continues to trend higher and bond prices turn lower then the consumer cyclical and tech sectors do better. That is about as basic as we can make it.
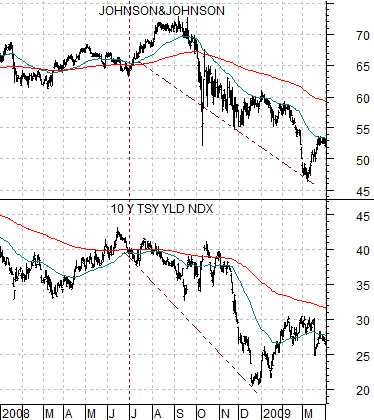
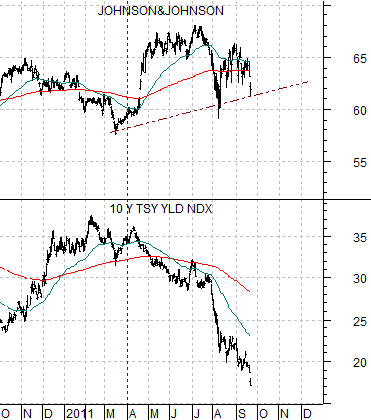
The problem in 2008 was that the consumer defensive stocks outperformed simply by not going down in price as far. We wanted to look at a comparison to that time period to get a sense of how things are progressing this year.
Below are charts of Johnson and Johnson (JNJ) and the 10-year U.S. Treasury yield index. The top chart is from 2008 while the lower chart is from 2011.
One argument has been that the entire correction in 2008 ran over the final six months of the year and that a similar outcome this time around would suggest that bond yields should reach a bottom towards the end of this month.
In any event… up until yesterday the trend for JNJ was holding nicely in response to falling yields. In 2008 defensive stocks such as JNJ busted lower with the broad stock market even as yields declined. The closer JNJ is to its 200-day e.m.a. line the greater our conviction that we are not once again in a cascading stock market trend and that strength in the large cap defensive stocks will serve to buffer the downward pressure from the commodity cyclicals.
Quickly… if we run a channel over the chart of the U.S. 30-year T-Bond futures the upper edge (resistance) cuts through around 150. Based on a 30-year bull market trend the TBonds should have trouble rising much above this level.
Rising bond prices lead to the equity markets outperforming commodity prices so unless the equity markets show some strength there will be considerable pressure on commodity prices until bonds find some kind of price top.