We suspect that ‘short-term’ for us is probably a few months while ‘long-term’ is however long it takes for the markets to move in the direction that we have been arguing. For today, however, we are going to expand somewhat on the picture that we presented on the first page of yesterday’s issue.
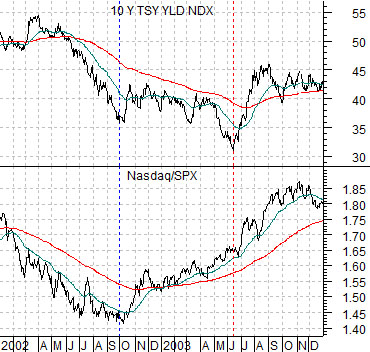
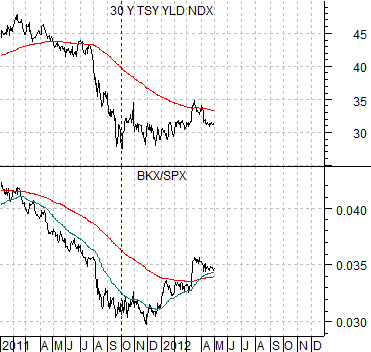
First is a chart of the Nasdaq/S&P 500 Index ratio and 10-year Treasury yields from 2002 to 2003. Next is a chart of the Bank Index/S&P 500 Index ratio along with 30-year yields from 2011- 12.
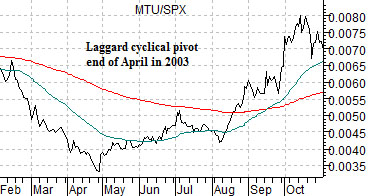
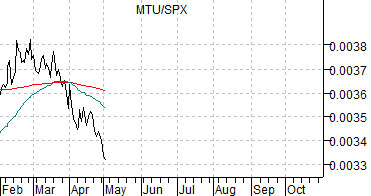
The BKX/SPX ratio and yields began to improve at the end of September last year. The Nasdaq/SPX ratio began to rise at the end of September in 2002. While yields did not reach bottom until June of 2003 the equity markets anticipated the pivot by firing the ratio between Japanese bank (and lagging cyclical) Mitsubishi UFJ (MTU) and the SPX upwards at the end of April in 2003.
The point? If the recovery this year is on the same basic schedule as 2003 this is about the time when we might see some strength in the lagging cyclicals.
Equity/Bond Markets
From Bloomberg yesterday, ‘Oil fell after the U.S. Energy Department reported that crude inventories surged to the highest level in more than 21 years and production and imports climbed.’
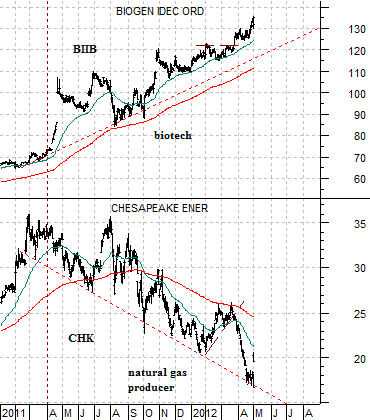
We have been arguing in favor of biotech and against the energy sector for quite some time. To update the trend we have included a comparison between Biogen (BIIB) and Chesapeake (CHK) below.
This might not be the most fair of comparisons but it is one that we have shown on quite a few occasions. The argument is that CHK began to trend lower around the end of the first quarter of 2011 which marked the start of renewed price strength for BIIB.
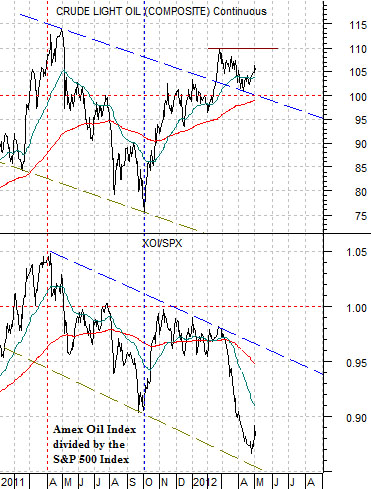
Below is a chart comparison between crude oil futures and the ratio between the Amex Oil Index (XOI) and S&P 500 Index (SPX).
The basic point is that the energy trend turned lower at the end of March in 2011. Crude oil futures prices apparently haven’t come to grips with the fact that the underlying trend has been bearish for the past year. On occasion we have argued that crude oil futures prices above 100 are justified IF the XOI/SPX ratio is higher than 1:1. Which, of course, it isn’t.
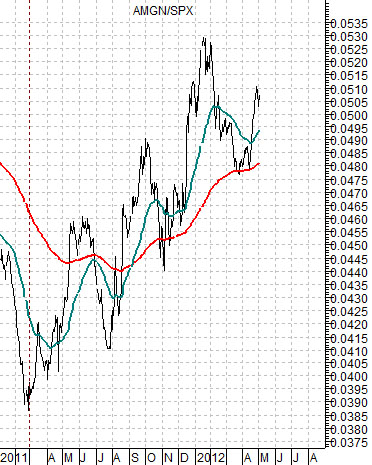
As the energy trend fades lower the biotechs prosper. The chart below features the ratio between Amgen (AMGN) and the SPX. The ratio bottomed in March of 2011 at the top of the energy cycle and is apparently still on the rise. The point is that if the biotechs are moving higher on energy price weakness then it won’t make sense to swing back into the oil and gas stocks until the biotechs start to show some actual price weakness.