The issue is not whether the equity markets can move lower but rather whether this is the start of a replay of 2008. In other words we can all probably live with a few percentage points of near-term down side pressure as long as the equity markets are not poised to test or break last year’s lows.
Our view is actually quite constructive at this juncture. If the bond market behaves by holding last week’s price highs then we can actually make a case for a sharp stock market recovery starting almost immediately. A more conservative argument would be that following a major bear market bottom- similar to 1982 and 2003- the stock market tends to run out of upward momentum a year or so into the recovery leading into a reasonably choppy period of consolidation. Given the alternative of a potential collapse… choppy consolidation doesn’t seem so bad.
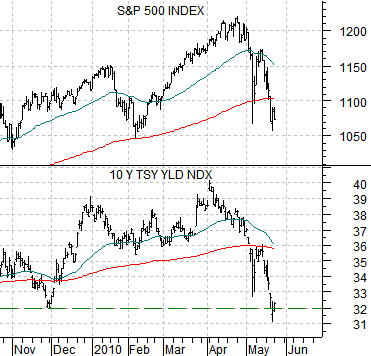
Below we show the S&P 500 Index (SPX) and 10-year U.S. Treasury yields (TNX). We will do the SPX and the T-Note futures on the following page.
The point is that 10-year Treasury yields hit the proverbial ‘wall’ as they approached 4% in early April as the yield spread between 10-year and 3-month Treasuries widened to an extreme. At that juncture one of two things had to happen- either short-term yields and the Fed funds rate were ready to rise or long-term yields had to work somewhat lower.
The decline back to 3.2% was a bit more dramatic that we might have expected but the chart argues that this is a reasonable place for support to show up. As long as last week’s lows for yields holds we can make the argument that a stock market bottom is in sight.
At bottom we compare the share price of Panasonic (PC) with Japanese 10-year (JGB) bond futures.
The point here is that the JGBs made a hard run- for the third time since late last year- at the 140.50 level but have managed so far to hold an essentially flat trading range. PC has backed all the way down to the lows set in November around the peak for Japanese bond futures prices.
We can circle the point again and again but our conclusion is that if the JGBs remain below 140.50 while 10-year Treasury yields find support at or very close to 3.2% (compared to last seen levels of 3.227%) then the equity markets should start to settle out.


Equity/Bond Markets
The strange thing about the markets of late is the number of divergences that have shown up. Sectors that should be outperforming with a strong dollar or with cyclical weakness haven’t shown much in the way of oomph leaving the broad market at the mercy of the index futures traders.
In any event… one of the key drivers helping bond prices rise has been relative weakness in Asian growth and copper futures prices. Once the copper/CRB Index ratio peaked in early April the bond market began to lift in price but the chart at right shows that unless the copper/CRB Index ratio is poised near the completion of a ‘crash top’ (we will show the comparison tomorrow… just in case) a case can be made for lower bond prices in the days ahead. In other words if copper prices continue to rise relative to the CRB Index then there is probably a few points worth of ‘air’ underneath the long end of the bond market.
IF long-term bond prices peaked last week THEN the equity markets should be close to a bottom. In fact they might already have made a bottom if history were to be kind enough to repeat exactly.
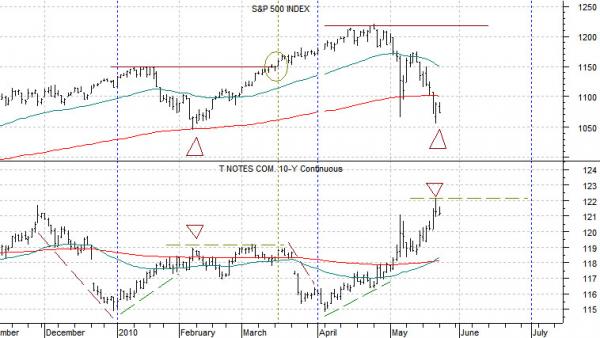
Below we show the SPX and the 10-year T-Note futures.
In early February the T-Notes hit a price peak that went with an intraday reversal (weak opening and strong closing) for the equity markets. The following day the SPX closed weaker although the index held above the previous day’s intraday lows.
The peak for bond prices marked the lows for the SPX in February so with the T-Notes trading below last Friday’s price peak the short-term argument is that we could already be on the road to recovery. All of this depends, of course, on the bond market not spiking to new highs any time in the near future.


