May 1 (Bloomberg) – Crude oil rose to a four-week high as U.S. consumer confidence improved and manufacturing shrank at the slowest pace in seven months, signaling that the recession will end later this year.
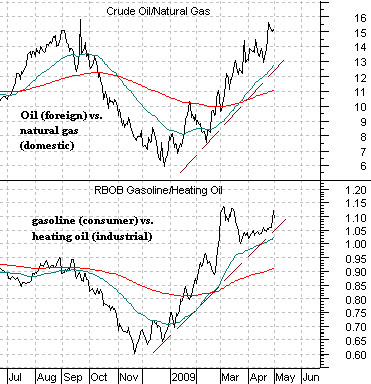
We tend to equate the gasoline/heating oil ratio with consumer spending versus capital spending and the crude oil/natural gas ratio with foreign growth versus U.S. domestic growth. To explain the former we have included the comment below:
“…demand for commodities such as gasoline or agricultural commodities, which are linked to consumer spending for non-durable goods, has been relatively resilient. In sharp contrast, commodities that are linked to demand for durable goods or industrial production, like metals or naphtha, have shown sharp demand declines. In the United States… diesel demand is highly levered towards industrial production and therefore not surprisingly weak. As the brunt of the credit crunch will likely continue to be borne by durable goods demand and industrial production for the rest of the year and the seasonal support from heating oil demand wanes, we believe that distillate demand will remain under significant pressure for the rest of the year.’Goldman Sachs, Energy Weekly, March 10, 2009 [Emphasis ours].
Belowwe show the ratios between crude oil and natural gas futures prices and gasoline versus heating oil. From December into May the trends have favored consumer spending and foreign growth.
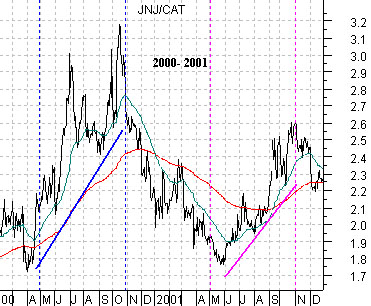
Belowwe feature a chart of the ratio between Johnson and Johnson (JNJ) and Caterpillar (CAT) from 2000- 2001. The JNJ/CAT ratio tends to trend higher during periods of real or perceived growth and lower when investors believe that growth is slowing.
There is a strong seasonal trend or bias within the markets that favors growth into the spring and weakness into the autumn. From year to year the markets react differently to this trend depending on whether ‘growth’ is perceived as a positive or a negative. In any event the chart makes the case that when the JNJ/CAT ratio has been trending lower into the spring it stands a good chance of resolving higher through into October. Our point is that it should come as no surprise that consumer confidence is improving because the markets have been trading and trending on that theme since the end of last year. The trend- in terms of ‘what is’- includes consumer spending strength and foreign growth. Our view is that ‘what will be’ could include the opposite trend with weakening consumer spending and slowing foreign (i.e. China) growth.
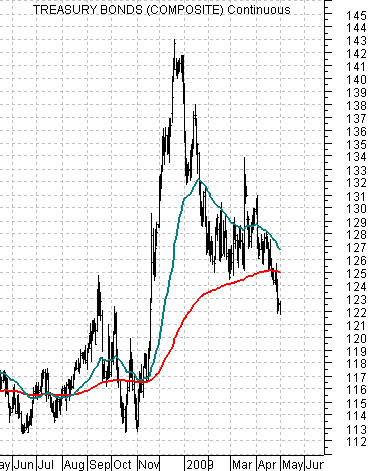
Belowis a chart of the U.S. 30-year T-Bond futures.
One of our core arguments this year has centered around last year’s peak for long-term Treasury prices. The idea was that falling bond prices go with improving economic growth. In early April, however, we noted on a couple of occasions that the TBonds had yet to break below the 200-day e.m.a. line. Our view was that if our thesis was going to work the TBonds had to resolve in price to the down side.
Over the past week or so the TBonds have finally ‘given’ at the moving average line. The next test should come when the 50-day e.m.a. line converges with the 200-day. Notice on the chart how the moving average line convergence marked the lows for the TBonds in June and July last year as well as in October and November.
At present there are three potential equity markets outcomes that we view as likely. The fourth would be a complete collapse but given that we are, in general, quite bullish we will stick with our top three.
The first outcome would involve something similar to 1990 with equity prices simply resolving higher through the balance of the year. We will come back to this argument in some detail tomorrow.
The second outcome involves an equity markets correction from May into August on weaker commodity prices and downward pressure on the commodity currencies. We show this again on page 5 today.
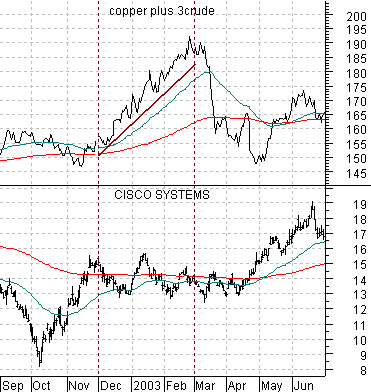
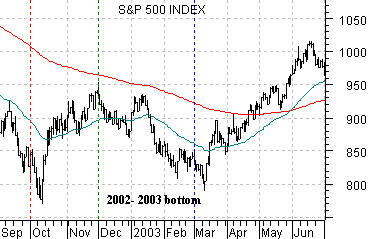
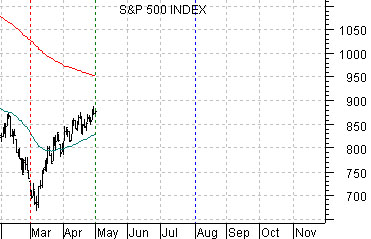
The third outcome is similar to the second in that equity prices decline from May into August but the ‘driver’ is somewhat different. Below right we compare the 2002- 2003 bottom for the S&P 500 Index with the current situation. After a 2-month rally through November of 2002 the stock market declined to a final bottom into March of 2003 based on a sharply rising trend for copper and crude oil prices and (chart on page 4) considerable strength in the Canadian dollar. Same equity markets result- a 3-month correction- but based on very strong instead of weak commodity prices.
