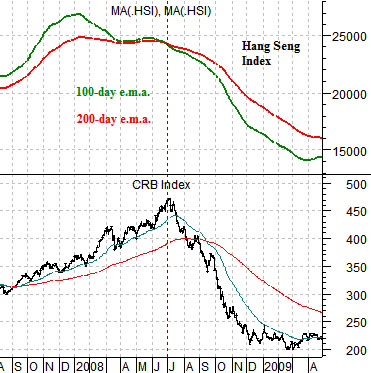
Below is a comparison between the CRB Index and two moving average lines for Hong Kong’s Hang Seng Index from 2007 into 2009.
The argument is that the base trend for the CRB Index turns negative when the 100-day e.m.a. line crosses down through the 200-day. The chart shows that the moving average lines crossed at the end of the second quarter in 2008 just ahead of the second half collapse of the commodity markets.
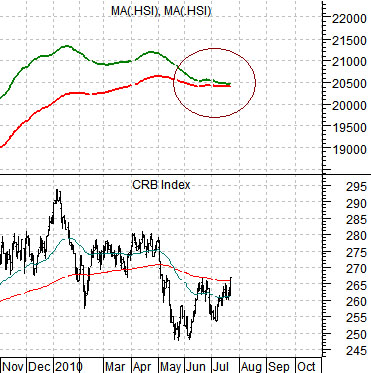
Below we show the current situation. Notice that the moving average lines have converged.
Below is a comparison between the Hang Seng Index and the U.S. Dollar Index (DXY) futures. In a sense the outcome is being driven by the dollar. As the dollar has resolved lower since early June the Hang Seng Index has risen which has helped to keep the moving averages lines from ‘crossing’. At time of writing a cyclical collapse (weaker Hang Seng) or cyclical resurgence (stronger Hang Seng) is a virtual coin toss depending on the near-term direction for the dollar. With the moving average lines for the Hang Seng at a point of convergence this seems like an ideal point in time for some kind of dominant theme to start to build.
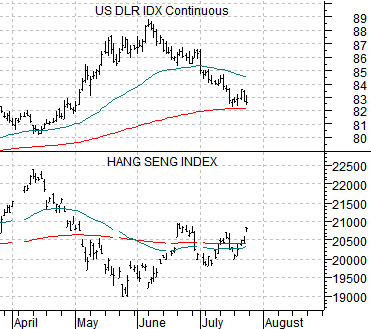
Our view has been that we are set to enter into a period of cyclical resurgence. In terms of the parameters discussed on page 1 this would appear to include a weaker U.S. dollar, stronger commodity prices, and a second wave of Asian growth. Aside from the dollar the key with respect to the ‘next trend’ likely lies with the bond market.
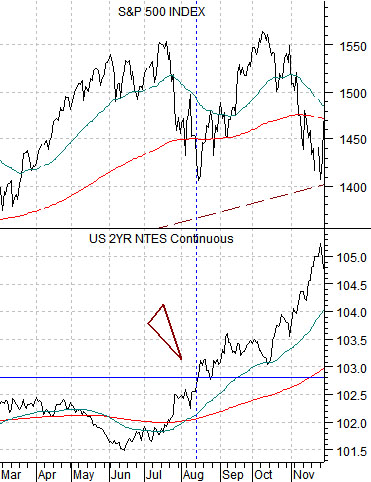
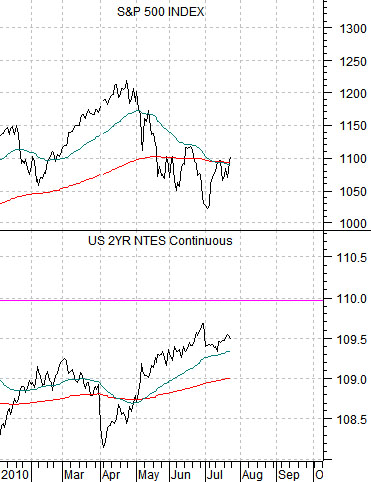
Below we show the S&P 500 Index (SPX) and the U.S. 2-year T-Note futures from 2007. Below right is the same comparison for the current time period.
In 2007 the SPX cracked lower from July into August on bond price strength. The bond market was rising to reflect slowing growth.
As the 2-year T-Notes broke through resistance in August the SPX swung back to new highs.
Our point is that the equity market sell off through this year’s second quarter went with rising bond prices. A case can be made that the SPX could return to the April highs even in the face of rising bond prices but this would likely prove to be a temporary rally ahead of a ‘double dip’ recession. Ideally equity markets strength will reflect weaker instead of stronger bond prices during the second half of this year.
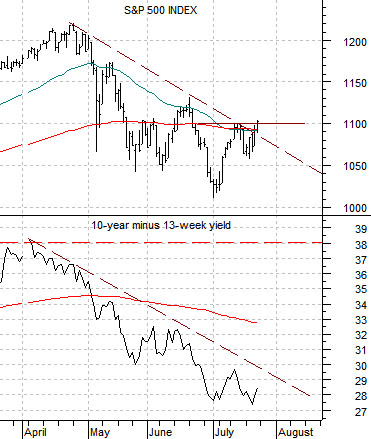
Below is a comparison between the SPX and the spread or difference between 10-year and 3-month Treasury yields.
A stronger SPX along with a rising yield spread suggests stronger cyclical growth. A rising SPX in the face of a falling yield spread opens up the potential for a 2007-type outcome (i.e. temporary rally ahead of a slowing economy). One of our views has been that we should maintain a bullish equity markets view UNTIL the spread between 10-year 3-month yields rises back up to 3.8%.