Within a calendar quarter there are three different points in time to look for a trend change. The first is roughly three weeks into the quarter. This is when the bulk of the previous quarter’s earnings reports have been released so if the equity markets have been selling off on the expectation of bad news or rallying on the hopes of ‘better than expected’ news directional pivots or changes often occur.
The second is mid-quarter. For some reason trend changes often take place close to the middle of the quarter with the first six weeks strong and the second six weeks weak and vice versa. The third trend change point is any day other than the ones mentioned above.
Aside from the feeble attempt at humor the point is that trends tend to change when least expected. Trends tend to reverse when the news that justified the tend to begin with is released. To the extent that so many are riding the ‘strong China’ theme at present as the economic news that supports the trend is released our thought is that as we approach mid-quarter this might be a good time to look for a trend change.
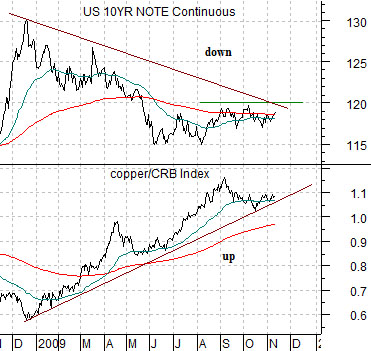
At top right we compare the U.S. 10-year T-Note futures with the ratio of copper futures to the CRB Index. The somewhat obvious point is that when the copper/CRB Index ratio is rising… bond prices are falling. If the T-Note futures were to resolve back above 120, however, the markets would be ‘saying’ that copper price strength has come to an end.
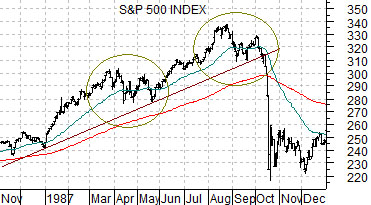
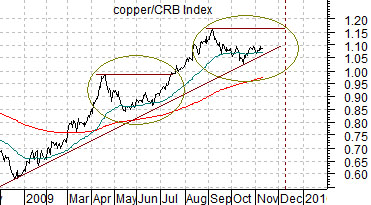
Below right we have included a chart of the S&P 500 Index (SPX) from 1987 and the copper/CRB Index ratio from the current time frame.
We do not get to our BIG point until the end of page 5 today but it has something to do with the markets doing a ‘reverse 1987’. For this to have any chance of occurring we suspect the bond market has to swing upwards until prices threaten last year’s highs.
The copper/CRB Index ratio made a peak in April and three months later (in July) had pushed on to new highs. It made a second peak in September and has a major decision point due new month. Is it onward and upward as the trend extends or will the ratio fail back through the support line with bond prices rising in tandem? We suspect that the answer will become clear over the next few weeks.
Equity/Bond Markets
LONDON, Nov 11 (Reuters) – Copper tracked back from earlier highs late on Wednesday, pressured by dollar fluctuations but boosted by expectations of strong demand from China, the world’s top copper consumer, after robust economic data.
The point is that there is a relationship between copper prices and Chinese economic strength and there is also a relationship between copper prices and long-term U.S. Treasury yields. This suggests that there is also a relationship of sorts between China’s economy and the U.S. bond market.
At right is a comparative view of copper futures (scaled in semi-log) and the price spread or difference between 30-year and 10-year Treasury futures.
The 30-10 spread goes with the bond market. In other words it rises when bonds rise and falls when bonds decline. It rises because in a positive bond price trend 30-year bonds will move faster than 10-year bonds while the opposite is true in a bond price bear market.
In any event… copper has been crawling up a rising trend line all year and the longer prices struggle at the 3.00 level the greater the pressure on the positive trend. Each time the bond market starts to lift in price with the 30-10 spread moving higher… there is a chance that copper prices are ready to turn lower.
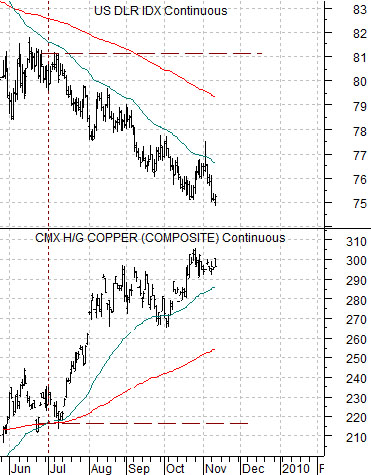
Below right we compare copper futures with the U.S. Dollar Index (DXY) futures. Our recurring thought is that dollar weakness since the start of the third quarter has kept copper prices rising. If the dollar starts to rise and breaks above 77 we suspect that it may not stop until it take a run at 81 which, of course, would pressure copper prices back towards 2.20.
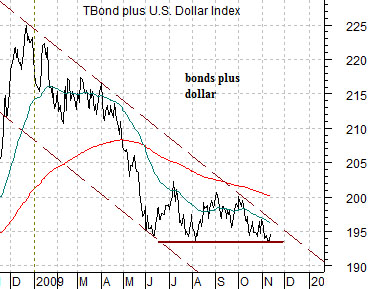
So… here is our point. Following the release of a variety of economic statistics from China we had a minor gains in oil and copper prices, a flat dollar, and a strong bond market. Why were the dollar and bond market better yesterday? One answer might come from the chart below. The sum of the U.S. 30-year T-Bond futures and U.S. Dollar Index futures (the inverse or offset to copper and crude oil prices) was on key support having closed the day before right on the August lows. If the bond market and dollar were going to show any kind of strength this is the time for it to begin.