We often write that the market is similar to some previous time frame. Our view is that the markets go through cyclical swings with excesses to both the upside and down side and that broad similarities exist between various time frames. On the other hand the markets rarely repeat ‘exactly’ so we are constantly digging through the minutia in search of the driving forces behind price changes.
Our little preamble was meant to set the stage for a comparison. A comparison, by the way, between two different time frames with two quite different ‘drivers’.
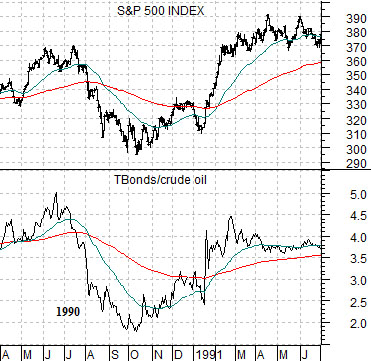
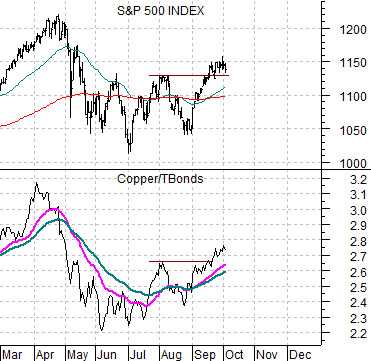
Below is a comparative view of the S&P 500 Index (SPX) and the ratio between U.S. 30-year T-Bond futures and crude oil futures from 1990- 91.
The bear market for equities into the autumn of 1990 was reflected by two forces- strong crude oil prices leading up to and into the Gulf War- and falling bond prices. When crude oil prices finally peaked in early October the bond market bottomed. The combination of rising bond prices and weaker energy prices helped lift the S&P 500 Index rather rapidly back to new highs.
The current situation is revolving around a different combination of commodity and bond prices. In the back pages for some time we have shown the SPX against the ratio of copper futures divided by the TBond futures. The argument has been that the equity markets are locked in to copper and bond prices.
Does this make sense? We actually believe that it does. The markets are split between two very different themes these days. Asian growth- shown by the trend for copper prices- is acting as a positive while U.S. weakness- reflected by rising bond prices- has been a negative.
A bullish scenario going forward includes continued strength for copper and falling bond prices as Asian growth helps to lift U.S. growth. A bearish outcome involves continued strength in bond prices and a down turn in copper prices as U.S. weakness swamps the Asian recovery.
At present the copper/TBond ratio is just strong enough to support the SPX at levels above 1130 but not quite robust enough to power it through 1150.
Equity/Bond Markets
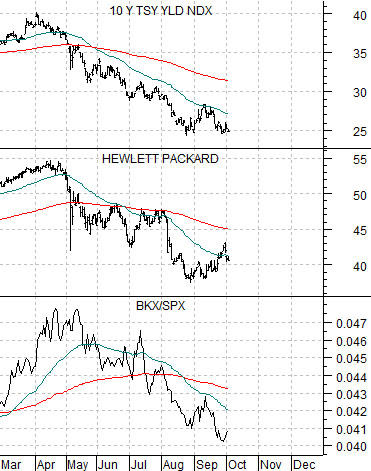
Below is a comparison between U.S. 10-year Treasury yields, the share price of Hewlett Packard (HPQ), and the ratio between the Bank Index (BKX) and S&P 500 Index (SPX).
The argument is that U.S. cyclical weakness is showing up through falling yields, a weaker trend for the techs (we could have used Intel or Microsoft for this chart), and relative weakness for the banks which is by and large, a reflection of ongoing pressure on U.S. home prices.
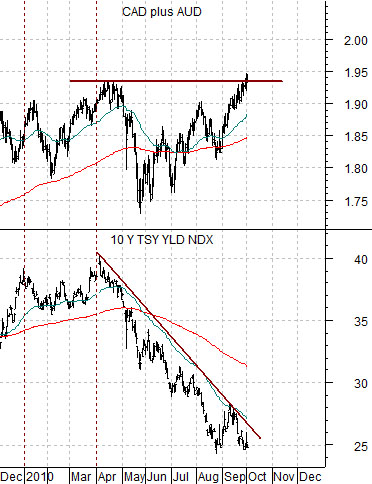
The chart below compares 10-year yields with the sum of the Canadian and Australian (CAD plus AUD) dollar futures.
We can see that yields are falling with tech and the banks but we can also see that as the commodity currencies are trading as if cyclical growth is positive.
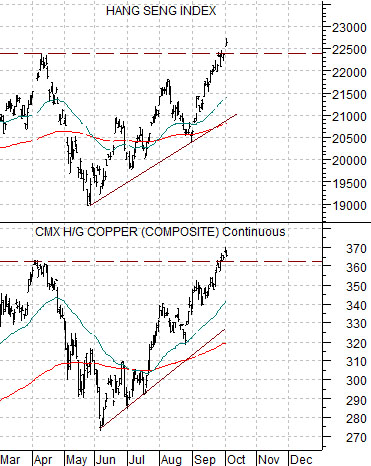
Another spin on the argument is shown below right as we compare copper futures with the Hang Seng Index from Hong Kong.
Notice that copper and the Hang Seng Index have moved above the highs set last April when 10-year yields were closer to 4.0% than today’s level of 2.48%. On the one side we have a rising trend for Asian growth shown through copper futures, the Hang Seng Index, and the commodity currencies while on the other side we have clear weakness in U.S. growth as defined by the negative trend for Hewlett Packard and the BKX/SPX ratio. This leads to two potential outcomes over the next few months with one supporting the ‘double dip’ argument while the other revolves around China’s ability to power the global trend higher.