Nov. 9 (Bloomberg) — China’s central bank will “fine- tune” monetary policy in the final quarter of this year to prevent a return of inflation, according to a report from the nation’s debt registration association.
Nov. 9 (Bloomberg) — China’s central bank and banking regulator may “soon” issue measures to limit the use of debt in real-estate purchases after asset prices climbed, a Shanghai official said… A record $1.27 trillion of new loans this year and inflows of cash from investors betting that the yuan will appreciate threaten to create stock and property bubbles.
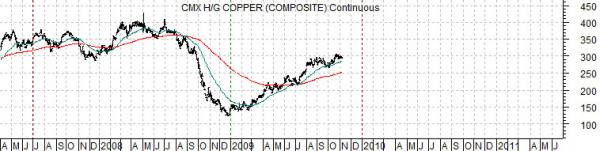
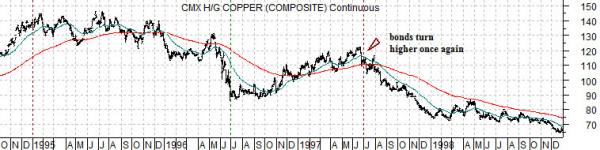
Below are two charts of copper futures. The charts have been set up so that the start of rising bond prices and falling interest rates in 1995 lines up with the turn higher in the bond market and Japanese yen in mid-2007.
The argument is that the rising trend for copper prices through 2009 is similar to the bear market rally that pushed copper prices higher between the start of the third quarter in 1996 and the end of the second quarter of 1997. If history were to repeat exactly- and wouldn’t that be a surprise- then copper prices would remain reasonably strong into year end before turning back to the down side through into 2011.
So… why would copper prices turn lower next year? The argument in favor of higher copper prices has always been that the initial rally for copper prices will be due to Chinese demand but once the recovery broadens out demand from the U.S., Europe, Japan, et al will push prices on to new highs. The counter to this would be that Chinese demand tails off as the fiscal and monetary reigns are tightened while global demand remains tepid.
What we find intriguing about this comparison is that even if it works perfectly it is still difficult to forecast how it will impact the various markets. It would obviously be a positive for the long end of the bond market- copper prices and yields tend to trend in the same direction- and we can surmise that it would go with a stronger U.S. dollar but… the link to the equity markets is less clear. The most likely outcome would be a return to relative strength for the interest rate sensitive and consumer growth sectors although we can also make a case- if pressed- for everything from technology to the consumer cyclicals. For now, however, the cyclical commodity trend appears set to remain positive especially on those days when the U.S. dollar shows weakness.
Equity/Bond Markets
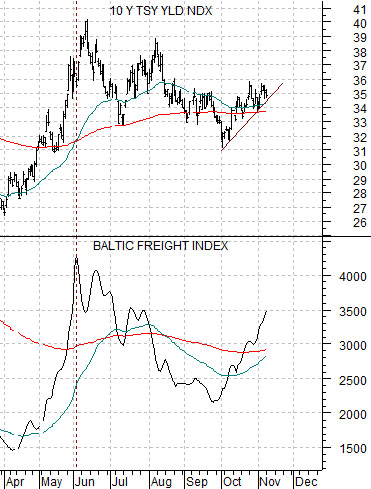
Below is a comparison between 10-year Treasury yields (TNX) and the Baltic Dry Index.
The argument is that Treasury yields tend to trend with ocean shipping rates for dry bulk cargo. In general the freight index tracks quite closely with yields and even leads- by a week or so- at the turns.
The point is that through October and into November ocean shipping rates have been rising which puts upward pressure on yields. Fair enough.
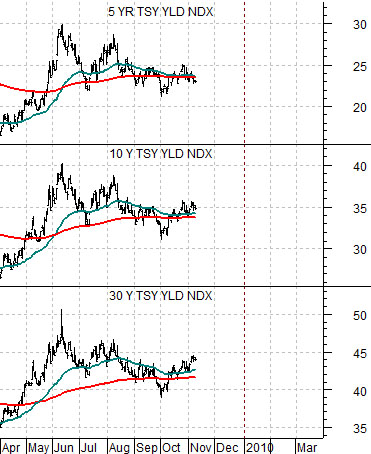
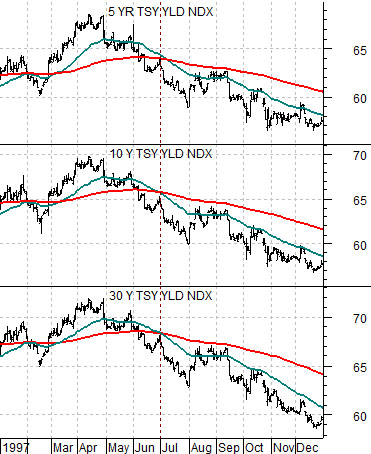
At bottom we have included a comparison between 30-year, 10-year, and 5-year U.S. Treasury yields from 1997.
The argument above was that the current trend for copper prices appears somewhat similar to the trend that extended through into the summer of 1997. Our focus today is on what happened to yields in the weeks and months leading up to the down turn for copper prices at the end of the second quarter that year.
The somewhat obvious point is that while copper futures prices continued to make recovery highs through into the month of June that year… yields actually peaked and turned lower in April. By the end of the second quarter 5-year, 10-year, and 30-year yields were all below their respective 200-day moving average lines with the 50-day e.m.a. line crossing to the down side at the end of June.
Below is the same comparison for the current time period. Notice how close the moving average lines were to crossing early in October. Ocean freight rates swung higher around this time which helped push yields back above the 200-day e.m.a. to extend the cyclical recovery.