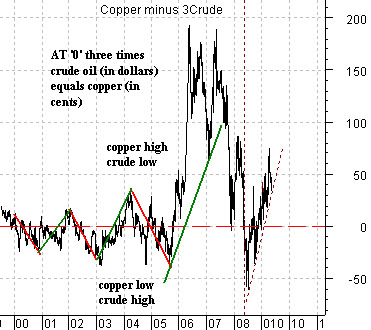
We start off today with a chart of the spread or difference between copper futures prices and crude oil futures.
The chart consists of copper futures in cents minus 3 times crude oil futures in dollars. The argument is that over time copper futures tend to be ‘fair’ around three times crude oil futures. In other words if copper is trading around 3.00 (300) then the markets would be somewhat balanced if crude oil was trading close to 100.
The chart shows that over time the spread tends to move above and then below the ‘0’ line which means that there are periods of time when copper is ‘high’ relative to crude oil and other periods of time when it is ‘low’.
We have also argued in the past that ‘Asian growth’ tends to be positive when copper is rising relative to crude oil. When the spread line is strong and rising the Chinese equity market, for example, tends to be very strong. The Shanghai Composite Index rose from around 1000 in mid-2005 up to 6000 into the autumn of 2007 and most would agree that it is Chinese growth that has powered the markets’ recovery this year as the copper minus crude oil spread has powered upwards.
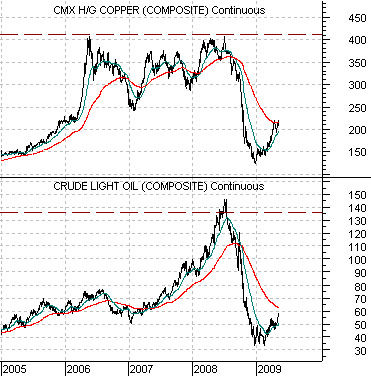
Below we show a simple chart comparison of copper and crude oil futures from 2005 to the present day.
Our point is that copper prices rose to around 4.00 in 2006 and then held near that level right through into mid-2008. In a sense the relentless rise in crude oil futures was the result of the markets working to come back into balance because in terms of the spread a level of 4.00 for copper was roughly equivalent to 135 for crude oil.
So… why are crude oil prices strong and rising in the face of an abysmal supply/demand imbalance? One answer would be that copper trading above 2.00 is pulling crude oil futures prices towards the 65- 70 range.
Our final point is that the rising trend for the copper minus crude oil price spread has declined almost exactly back to its support line (see chart on page 7 for a better perspective). To the extent that Asian equity markets rise with this spread while the share price of Wal Mart tends to weaken our view is that if the spread begins to decline as WMT gains relative strength… then the intermarket back drop for the Asian equity markets has swung from positive back to negative.
Equity/Bond Markets
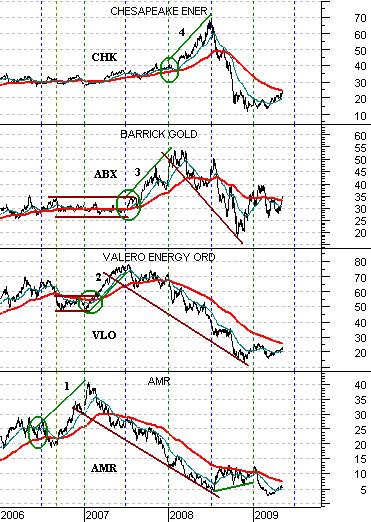
Below we show a comparative chart of, from bottom to top, the share prices of AMR, Valero (VLO), Barrick (ABX), and Chesapeake (CHK).
The argument over the years has been that the markets have tended to push the commodity or energy themes higher through the first half of the year and then rotate over to the non-energy themes for the second half of the year.
The chart shows that AMR was very strong through the last half of 2006 while oil refiner Valero was a relative strength leader during the first half of 2007. The second half of that year was dominated by the gold miners (Barrick) but as 2008 began the trend shifted back to the energy theme as natural gas producer Chesapeake doubled in price. We could even make the case that AMR returned to relative strength during the second half of 2008 as its share price rose from around 5 to over 10.
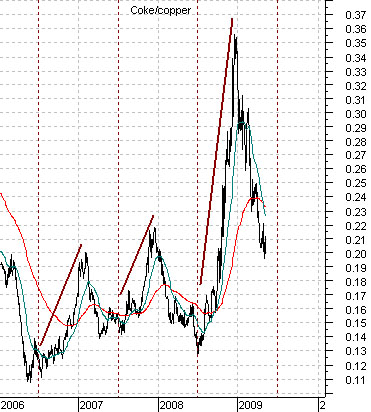
Another view of this argument is shown below using the ratio between the share price of Coca Cola (KO) and copper futures. The idea is that the ratio tends to decline through the first half of the year as copper is stronger than KO and then pivot upwards as KO rises relative to copper into year end.
The point? It is mid-May and not early July so we are somewhat early in showing this but we do expect the back half of the year to once again be dominated by the non-commodity equity markets sectors.
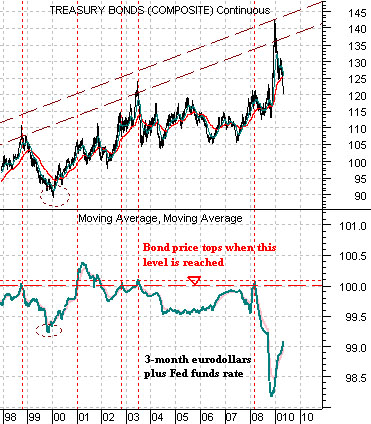
Below we show the U.S. 30-year T-Bond futures and the sum of the price of 3-month eurodollar futures and the Fed funds target rate. The quick point is that bond market tops tend to be made when the sum of 3-month eurodollar futures (currently around 99.20 to yield .8%) and the Fed funds rate (currently around .20%) rises nicely above 100. Our very quick point is that the bond market still faces a fairly strong upwards ‘push’ so once the cyclical recovery runs out of momentum expect to see long-term Treasury prices resolving back to the upside.