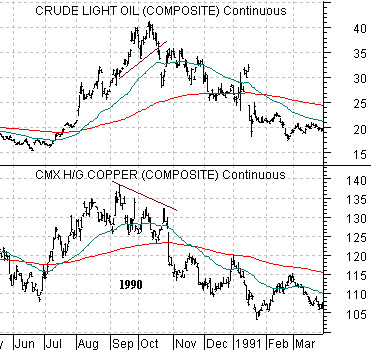
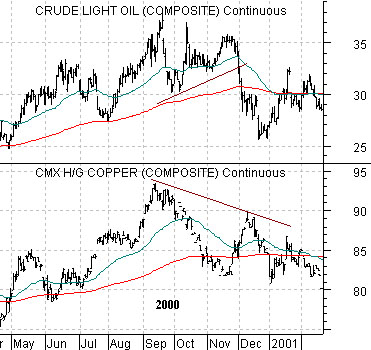
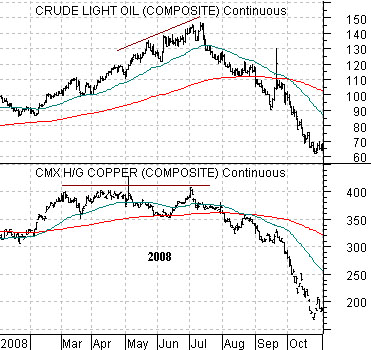
We have been fixating over the chart of copper futures this month so we thought we should explain what we are looking for and why it matters. We have included three chart comparisons of crude oil futures and copper futures. The charts beloware from 1990, 2000, and last year (2008).
There is a tendency at cyclical markets peaks for copper prices to top out a month or two ahead of crude oil prices. This suggests that as long as copper futures prices are making new highs then there is a reasonable chance that crude oil prices are still in a rising trend.
Notice, for example, the way copper prices topped out in September of 1990 while crude oil prices pushed upwards into the start of the new quarter in October. In 2000 both copper and crude oil peaked in September but while copper prices tumbled into November oil prices were retesting the highs. In 2008 copper prices made a top between March and early May even as oil prices went on to threaten the 150 level in July.
Our thought was that if copper prices were to fail back below 2.20 then copper prices have been making a ‘top’ since March which would support the contention that oil prices are due to turn lower around the end of this quarter.
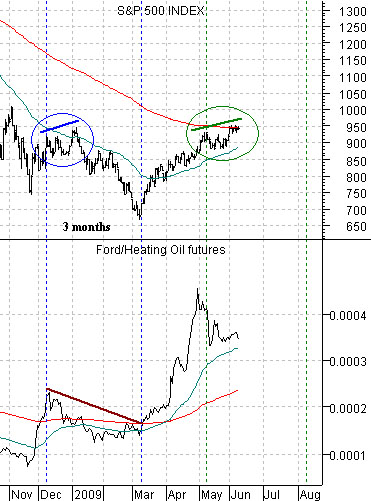
Belowis a chart that we have been using to get a ‘feel’ for the trend for the S&P 500 Index (SPX). The chart compares the SPX with the ratio between the share price of Ford (F) and heating oil futures.
The argument is and has been that the ‘base trend’ for the equity market turns positive at the lows for the F/heating oil ratio but in past instances the ‘real trend’ tends to show up 8 to 9 months later. In other words… some time closer to August.
The F/heating oil ratio peaked in early December, the SPX carried higher into early January, and then collapsed into early March. With the ratio once again hitting a high in early May while the stock market has maintained a positive bias through into June… the idea was that we could have one last spate of weakness that would end once the ratio made its next bottom.
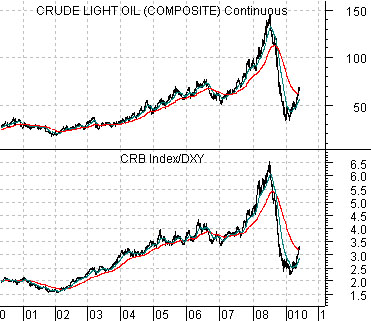
Below we show a comparison between crude oil futures and the ratio between the CRB Index (commodity prices) and the U.S. Dollar Index (DXY).
The chart makes the case that the trend for oil is one part ‘commodity’ and one part ‘currency’. Since the CRB/DXY ratio peaked a few weeks ahead of crude oil prices at the top last July we are using it for the comparison at bottom right.
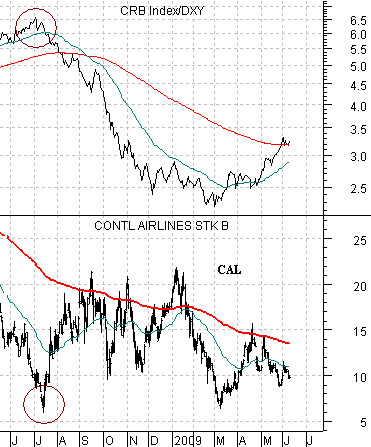
The final chart compares the CRB/DXY ratio with the share price of Continental Airlines (CAL). What we are attempting to do is find a bottom for the airline stocks because, as we have mentioned in previous issues, the first half of the year has tended to focus on energy prices while the second half has been dedicated to non-energy themes. Like the airlines.
What we are looking for even as oil prices make new highs is some sort of ‘top’ in the CRB/DXY ratio. If this ratio stops rising as a result of U.S. dollar strength (certainly not evident in trading yesterday) then a case can be made that we are approaching a reasonable bottom in airlines that will be set once energy prices finally turn lower. The first order of business has to be dollar strength although a push above 52 by Amgen one of these days would also be encouraging.