At present corn prices are close to one third the level of gold prices (323 vs. 948). Given that the ratio has only declined to current levels on three prior occasions since the 1970’s we thought that this might be a reasonable point in time to focus on something a bit different today.
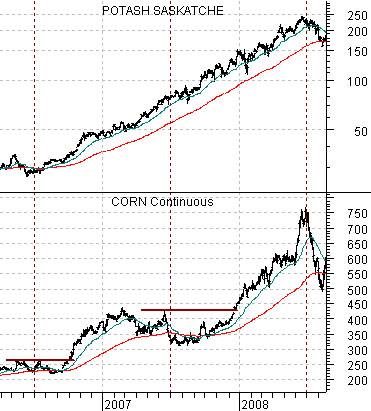
Below we show corn futures and the share price of Canadian fertilizer company Potash Corp. (POT).
We have a very simple view with respect to corn futures prices. We have argued that corn futures peak around the middle of the year- generally in June or July- and then sell off into the autumn. Every now and then the mid-year highs are taken out before the year comes to an end and when this happens… corn prices tend to rise rather powerfully into the next summer.
The chart shows that corn futures made a summer price peak in 2006 and then busted above those levels a few months later with the rally extending to a second price peak in mid-2007. After another price decline corn futures swung upward to make new highs towards the end of 2007 with the rally running all the way through the end of the second quarter in 2008. In other words in successive years corn futures reached a summer peak, declined, and then pushed to new highs before the end of the year.
In retrospect the action in corn futures prices should have been expected given the relentless strength in the fertilizer stocks. The Potash Corp.’s chart has been scaled in semi-log and it shows a steady and compounding price rise from the summer of 2006 through into the summer of 2008. Even as seasonal factors pushed corn prices lower the basic trend- as indicated by Potash’s share price- remained wildly positive.
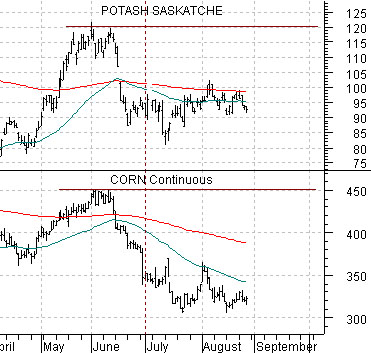
Below we show the current situation for corn futures and Potash. The first point is that both reached price peaks in June and have since sold off. The second point is that both are currently trading below their 200-day moving average lines which suggests that the trend is either neutral or negative at present. As opposed to 2006- 2008 when grains prices declined as POT walked up its 50-day moving average line the mid-year top this year has gone with just enough price weakness in the fertilizer share prices to indicate that today’s trend is in no way similar to the 2006- 2008 juggernaut.
Equity/Bond Markets
So… is the trend for corn prices relevant to the equity markets aside, perhaps, from the price trend for agriculture-related stocks such as Potash and Agrium? We will argue that it is.
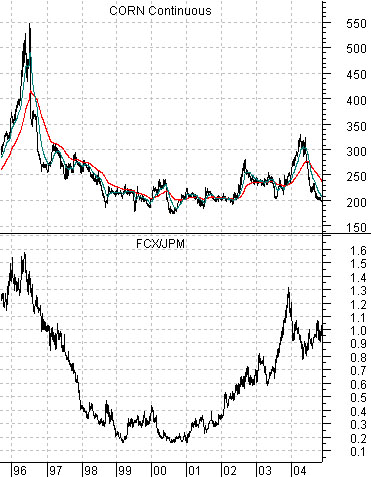
Below we show a comparison between corn futures and the ratio between the share price of FreePort McMoRan (a copper producer) and JPMorgan Chase (JPM).
What do FCX and JPM have to do with corn futures prices? Very little aside from the fact that they represent two very different themes. To grasp how this works one has to accept that corn prices do not rise or fall in a vacuum. By this we mean that corn prices are part of the much larger ‘commodity’ theme so a sustained price rally for corn will tend to take place when commodity prices in general and copper prices in specific are stronger. Corn prices can rise on weather-related issues but a sustained bull market requires that commodity prices in general are on the rise.
Corn futures prices peaked in 1996 at the top for the FCX/JPM ratio. The chart makes the rather bold assertion that in the relative strength war between basic materials (FCX) and financials (JPM) one owns the metals and miners when corn prices are rising and then switches back to the financials when corn prices turn lower. Since corn prices tend to top out around the end of the second quarter- as mentioned on page 1 today- the best time to look for a trend change is at the end of June.
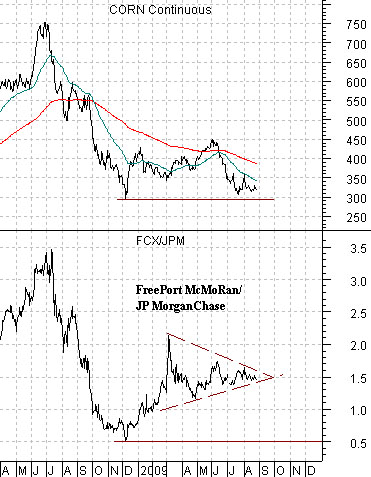
Below we show the same comparison for the time period extending from the spring of 2008 to the present day.
If corn prices peak in the summer and the trend for corn prices goes with the ratio between FreePort McMoran and JPMorgan Chase then- with the amazing clarity afforded by hind sight- the perfect time of year to look for a trend shift would be at the end of the second quarter. The chart shows that this was the exact peak for corn futures in 2008 as well as for the FCX/JPM ratio.
The issue, however, is not what happened ‘last year’ but what is or should be happening this year.
For a second year in a row corn futures rallied up into June before turning lower which, in turn, suggests that one should currently be favoring JPM over FCX.
One of our recurring themes of late has been the markets’ lack of trend conviction with respect to Asian growth and metals prices. Our argument is that once corn futures peak and turn lower the trend should shift back in favor of JPM versus FCX but through July and August the ratio has actually held almost perfectly flat. The intermarkets have argued for a declining ratio while the markets appear intent on reliving the last cycle’s commodity-related glories.
One of two things could happen as we work deeper into the second half of the year. Either corn futures prices swing back towards the summer highs confirmed by a solid push by Potash above its 200-day moving average line to support the stubbornly positive FCX/JPM ratio or… corn prices could break to new lows below 3.00 which would literally force the markets to come to grips with the new reality of disinflationary producer prices and relative strength in the major financials.