Yesterday certainly had a number of cross currents. Some weaker economic news from China led to lower copper prices while encouraging news from Greece sold off the dollar and U.S. bond market. The weekly jobless claims numbers were a bit high but not, apparently, to the point where it had an impact on yields.
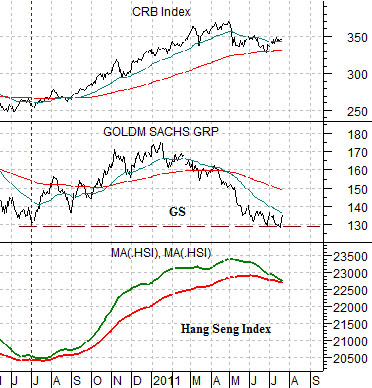
Below is a chart of the CRB Index, the share price of Goldman Sachs (GS), and two moving average lines from the Hang Seng Index from Hong Kong.
The argument is (and has been) that as long as the 100-day e.m.a. line does not cross down below the 200-day e.m.a. line for the Hang Seng Index the trend for commodity prices remains higher. There is also a general relationship between GS and the Chinese stock market (they have tended in recent years to peak and bottom around the same time) .
Our expectation is that the Hang Seng Index will rally to ‘save’ the moving average lines from crossing. Our expectation is that we will have another test around the end of the first quarter next year and if the trend is going to turn negative it will do so at this time. Whether our expectations prove out or not is another issue but with the moving average lines converging if strength is going to emerge it should do so almost immediately.
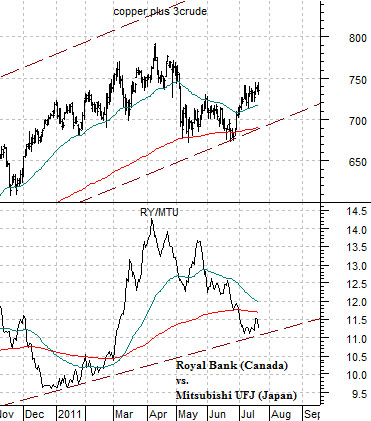
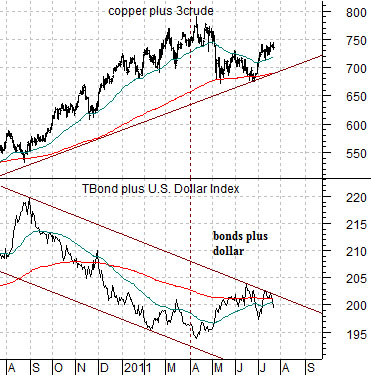
Below is a chart comparison between the sum of copper and crude oil futures (copper in cents added to three times the price of crude oil in dollars) and the sum of the U.S. 30-year T-Bond futures and U.S. Dollar Index (DXY) futures.
The argument here is that these two combinations trend in opposite directions. A weak bond market and dollar go with rising base metal and energy prices. A stronger dollar and bond market go with falling copper and crude oil prices.
The chart shows that the dollar and bond market have recently been strong enough to at least test the rising trend for copper and crude oil. The sell off in the bond market and dollar yesterday helped remove a bit of the pressure which, in turn, helps support the notion of ongoing cyclical strength.
Equity/Bond Markets
Next is a chart of the sum of copper and crude oil once again along with the ratio between Canada’s largest bank (Royal Bank) and Japan’s largest bank (Mitsubishi UFJ).
The RY/MTU ratio trends higher with the strong commodity price trend as commodity producers (Canada) do better than commodity users (Japan). It would be quite interesting if the RY/MTU ratio were to break down through the rising channel bottom. We suspect that it would say less about the cyclical trend and more about who the new winners and losers are going to be.
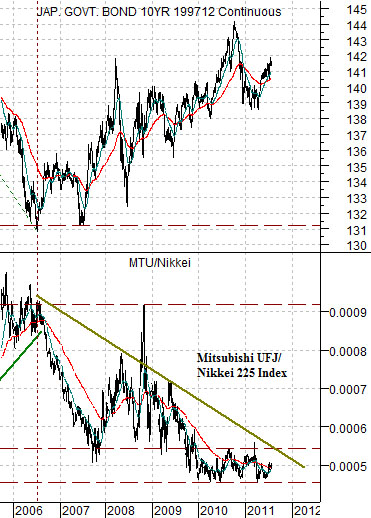
Below is a chart of the Japanese 10-year (JGB) bond futures and the ratio between MTU and the Nikkei 225 Index.
The idea is that MTU outperforms the Nikkei when bond prices are trending lower and rather markedly underperforms when bond prices are rising. The chart makes the rather simple point that the trend for bond prices has been ‘higher’ since 2006.
The point is that eventually the trend will gain sufficient traction to pull bond prices lower and when this happens the Nikkei should outperform the S&P 500 Index while MTU will outperform the Nikkei.
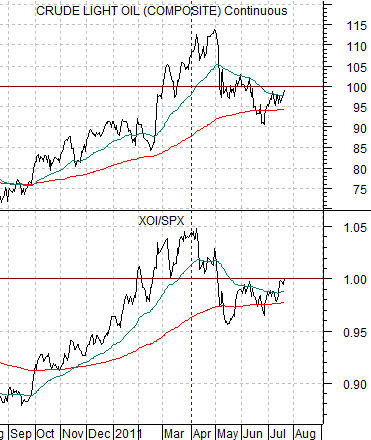
For all intents and purposes the equity markets are saying that crude oil (WTI) futures prices are ‘fair’ around 100. The chart below compares crude oil futures with the ratio between the Amex Oil Index (XOI) and the S&P 500 Index (SPX). We have argued that when the XOI/SPX ratio rises to 1:1 crude oil prices are fair and reasonable around 100. Given all that has happened in the markets over the past few months it is still strange to see the ratio so close to 1:1 while crude oil trades just under 100.