We have argued over the months that through the first half of the calendar year the energy theme has dominated while during the second half it has been ‘something else’. The idea is that from January through June the markets have pushed energy prices and long-term interest rates higher with the trends reversing through the second half of the year.
The trend change rarely takes place during a single trading session and is more of a process than a specific event. If strong energy prices go with rising yields and falling long-term bond prices then a reasonable way to monitor the trend is through the ratio between crude oil futures prices and the U.S. 30-year T-Bond futures. If oil prices are pushing upwards and bond prices are falling in response then the ratio will climb but as oil prices start to weaken and the bond market finds a bid… the ratio will work through a top before turning lower.
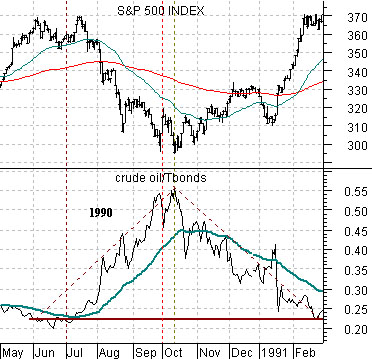
The chartbelow is from 1990. The chart compares the S&P 500 Index (SPX) with the crude oil/TBonds ratio from May of 1990 through February of 1991.
The point is that the equity market’s bottom in October of 1990 coincided with the peak for the ratio. At the highs for oil prices and the lows for bond prices the stock market reached a bear market bottom.
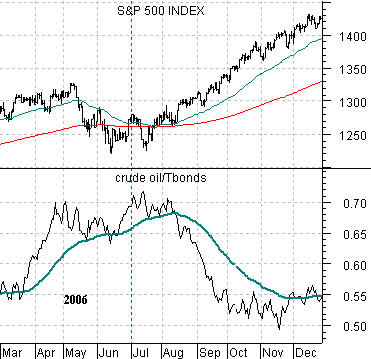
The chart below features the crude oil/TBonds ratio from 2006.
This is another very compelling example of how the equity markets can and have responded positively to a peak in the oil/bonds ratio. During 2006 the first six months of the year included stronger oil prices and falling bond prices while the back half of the year featured a reversal of the trend for both markets.
The problem is that the crude oil/TBond ratio peaked and turned lower at the end of the second quarter in 2008 but instead of a bullish response from the equity market we entered into something of a collapse. Our view is that the markets at present are set up in a manner similar to 1990 or 2006 so a return to weaker energy prices and falling long-term interest rates should lead to a bullish response from the U.S. equity markets.
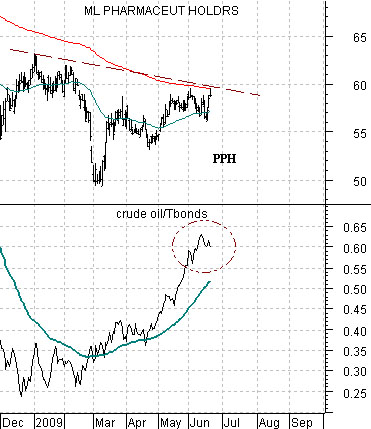
Belowwe show the ratio between crude oil futures and the U.S. 30-year T-Bond futures along with the pharma etf (PPH) from the current time period.
Once again… the argument was that if the recent trend were to repeat we would see a peak for the crude oil/TBonds ratio around the end of the second quarter. The obvious problem at the moment is that the second quarter has not yet come to an end. In general the last 3 or 4 trading days of a quarter can be quite volatile and only on very rare occasions do you see a strong trend disintegrate ahead of quarter end. Last week we did showed how the Nasdaq Composite Index collapsed in late March of 2000 to make the case that we could see weakness in gasoline futures prices towards the end of this month.
In any event… the argument is not that the crude oil/TBonds ratio has peaked but rather that when it peaks we should see a positive response from the broad equity market. The problem is that this is a good news/bad news proposition as falling bond prices cool the recovery for the prices of cyclical stocks while weaker energy prices put pressure on the energy and basic materials sectors.
Our thought is that a peak for oil prices and a bottom for long-term Treasury prices would be a positive for the consumer and health care sectors so instead of comparing the ratio to the SPX we are showing it in relation to the pharma etf (PPH). A push above 60 by the PPH along with continued weakness in the crude oil/TBonds ratio would be encouraging.
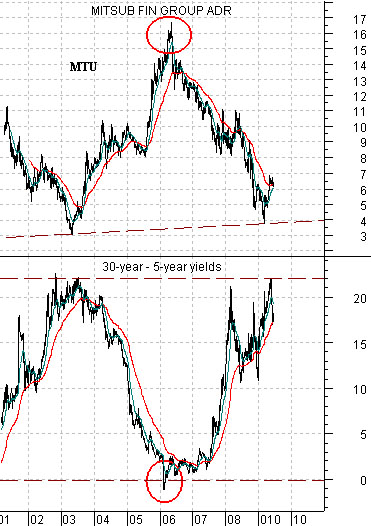
Belowis a comparison between the share price of Japanese bank Mitsubishi UFJ (MTU) and the spread or difference between 30-year and 5-year U.S. Treasury yields.
The argument is that the trend for MTU is virtually the mirror image of the trend for the spread between long-term and medium-term Treasury yields. When the yield spread is rising… MTU is falling… and vice versa.
With this in mind a positive trend for MTU would require a falling or narrowing yield spread which begs the question: what makes the yield spread decline?
The spread narrows when 30-year yields fall relative to 5-year yields or when 5-year yields rise relative to 30-year yields. In other words the spread line can decline if long-term interest rates decline or if shorter-term yields rise.
The Fed controls the short end of the yield curve so as long as the funds rate is nailed to the floor between 0% and .25% it is unlikely that 5-year yields are going to rise faster than 30-year yields. The more likely scenario- especially with spread close to 2%- is a period of weakness for long-term interest rates.
Once again… in recent years the markets have pushed energy prices and yields higher through the first six months of the year. The chart at right suggests that if history were to repeat… long-term yields should weaken through the second half of the year which would help to narrow the yield spread and support the share prices of the major financials.