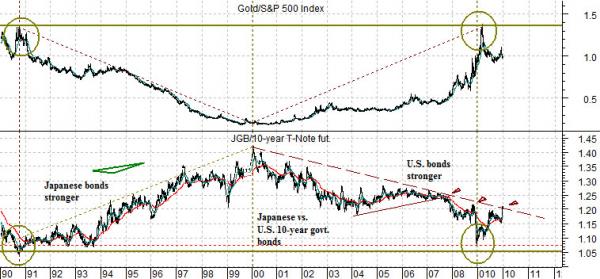
We are going to start out today with an observation based on the chart shown below. The ratio between the price of gold and the S&P 500 Index (gold/SPX) reached virtually the exact same level in early 2009 that it peaked at back in the second half of 1990.
The point, we suppose, is that the markets tend to push one asset class higher before rotating out to those sectors left behind. Goodness… we recall arguing on virtually a daily basis through 2002 and 2003 that it was time for the commodity cyclicals to take their turn in the sun. A great idea fouled nicely by far too little patience.
In any event… we thought we would show a chart comparison rife with complexities today. Sort of a thought provoker.
The chart below compares the ratio between gold and the S&P 500 Index with the ratio between the price of Japanese 10-year (JGB) bond futures and U.S. 10-year T-Note futures from 1990 through to the current time period.
At the peak for the gold/SPX ratio in 1990 the ratio between the JGBs and TNotes was at a low. At the bottom for the gold/SPX ratio in 2000 the Japanese/U.S. bond ratio was at a high. Fair enough.
Now… a rising JGB/TNote ratio means that… Japanese long-term yields are falling relative to U.S. yields. When the ratio trends lower- as it has done since 2000- it means that U.S. long-term yields are being pulled down towards Japanese yields.
Over the past two decades the markets have worked through two distinctly different trends. From 1990 into 2000 Japanese bond prices rose relative to U.S. bond prices while gold prices declined relative to equity prices.
From 2000 into at least 2009 the trend reversed with U.S. bonds rising in relation to Japanese bonds as gold prices rose against the broad U.S. equity market.
The point, by the way, is that rising U.S. yields and falling U.S. bond prices (pushing the JGB/TNote ratio upwards) this year is putting downward pressure on the gold/SPX ratio in a manner similar, perhaps, to 1991. If one is inclined to like gold- and many are- then one should hope to see the U.S. bond market rally in price and in the process pull the JGB/TNote ratio back towards last year’s lows. If so… then keep in mind that there is still serious resistance associated with a gold/SPX ratio close to 1.4.

Equity/Bond Markets
Jan. 7 (Bloomberg) — China’s central bank sold three-month bills at a higher interest rate for the first time in 19 weeks after saying its focus for 2010 is controlling the record expansion in lending and curbing price increases.
Stocks fell across Asia and oil declined on concern growth will slow in China, the engine of the world economy’s recovery from its worst recession since World War II.
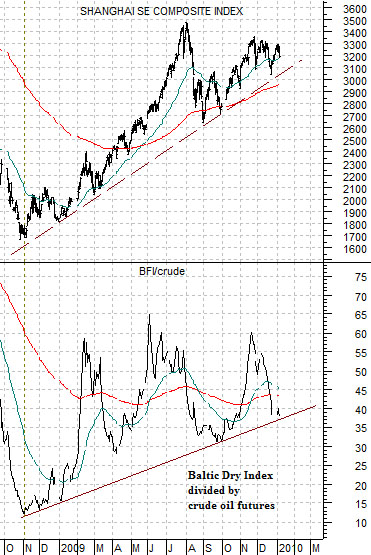
At right is a comparison between the Shanghai Composite Index and the ratio between the Baltic Dry Index (BFI) and crude oil futures prices.
The argument is that while oil prices rise with strong Asian growth when the ratio between bulk freight shipping rates and crude oil prices breaks to the down side it marks downward pressure on Asian equities.
The chart shows that the ratio is still holding the rising trend line but only by a very small margin. Through trading yesterday the trend for the Shanghai Comp. was still positive although any weakness down through the 3000 level- especially if accompanied by further losses in the BFI/crude oil ratio- would result in a trend change.
Below is a chart of the ratio between the share price of Wal Mart (WMT) and the Shanghai Comp.
WMT has shown the peculiar tendency in the past of rising as an offset whenever Asian growth begins to flag. In other words- if history were to be kind enough to repeat- one indication of an impending cracking of the China/commodity theme would be strength in the share price of WMT.
One of the ways that we follow this is through the WMT/Shanghai Comp. ratio. Notice that the ratio swung upwards in the autumn of 2007 as the Shanghai Comp. declined and WMT rose in price. The intriguing detail this year has been the ‘flat’ trend for the ratio right on the moving average lines as the markets try to figure out which way to jump next. Once again- through trading yesterday- the markets had yet to determine the direction of the next trend.


