Some believe that there are no such thing as problems- only opportunities. If that is the case then we readily admit that the current market is causing us no end of opportunities.
In the process of constructing a thesis we draw upon dozens and dozens of mental pictures and relationships gleaned from spending far too much time pondering charts. Over time we attempt to show as many of these relationships as possible but as new information arrives each and every trading day the forest is often lost for the trees. Today we are going to take a rather large step backwards in time and scope to show one of the issues that is and has been vexing us.
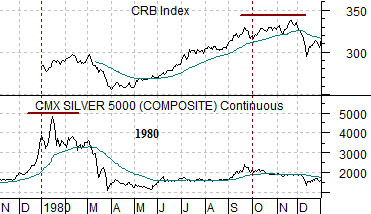
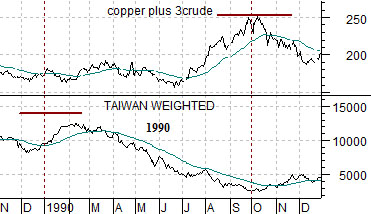
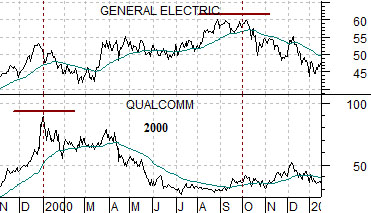
At right are three comparative charts. The top chart compares the CRB Index with silver futures from 1980. The middle chart shows the Taiwan stock market and the sum of copper and crude oil futures from 1990, while the lower chart contrasts Qualcomm (QCOM) with General Electric (GE) from 2000.
Three different time frames each with different comparisons. What do silver futures have in common with Taiwan and Qualcomm? Each represented a parabolic end-of-decade cyclical trend. In 1979 the Hunt brothers were busy trying to corner the silver market, through 1989 the Japanese and Taiwanese stock markets were rising parabolically, and in through the end of 1999 the internet and telecom shares were launching into the stratosphere.
Three ‘9’ years marking the end of a decade building into three parabolic price advances in three different cyclical markets. Silver, Asian equities, and tech/telecom.
The point is that in each instance the markets completed the cycle through a ‘double top’. By this we mean that the peak in silver, Taiwan, and Qualcomm marked the leading edge of a ‘top’ that was completed almost exactly nine months later through a cycle peak for commodity prices (in 1980), a peak for metals and energy prices (in 1990), and a top for large cap U.S. equities (in 2000). The end of a multi-year cyclical run included a ‘bubble top’ in a fairly specific market followed by a broader top for cyclical asset prices three calendar quarters later.
Equity/Bond Markets
The first page arguments were as follows:
If history were to repeat we would expect a ‘major asset price cycle’ to conclude in the following sequence. First, it would likely peak around the end of a decade (similar to 1980, 1990, and 2000). Second, it would include a fairly narrow parabolic rise in an asset class or market. Third, it would be followed nine months later by a more general peak. Fourth, it would lead into a recession. Fifth… when it was done… it would be done for years to come.
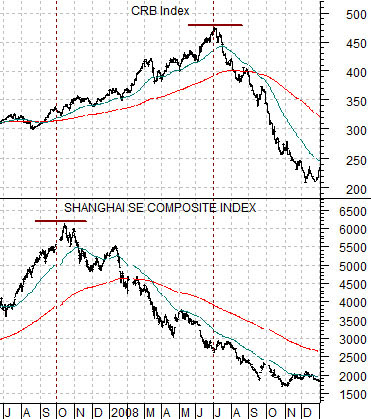
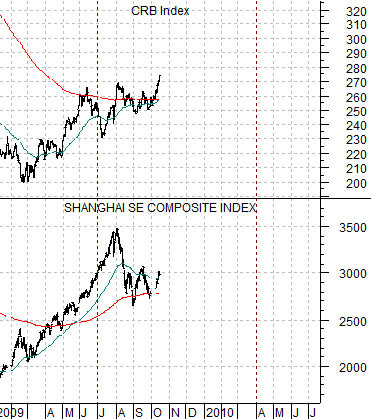
With this in mind we turn to the chart above right of the Shanghai Composite Index and the CRB Index from the summer of 2007 through 2008.
In our thesis the Shanghai Comp. represented silver, the Nikkei and Taiwan, and Qualcomm. The market rose to a peak into the autumn of 2007. This marked the beginning of the sequence.
In our thesis the CRB Index represented the trailing broader cyclical peak that was expected to occur nine months later. In other words a peak for the Shanghai Comp. at the end of the third quarter in 2007 followed by a price collapse for commodities in the summer of 2008 made perfect sense. To us, at least. The second part of the sequence had fallen into place.
We had a specific market top, a trailing cyclical top nine months later, and most certainly a recession. The only detail missing was that the entire process did not begin at the start of a new decade.
To put this into some form of perspective we will point out that when energy prices peaked in 1980 they did not hit new highs (we use heating oil futures for this) until 2004. At best gold prices remained below the 1980 lows until 2007- 2008. The Taiwan stock market (using the Taiwan Weighted Index) has not made new highs since 1990 and the Nikkei 225 Index is still a mere fraction of its 1990 peak. Almost a decade later most of the major tech and telecom stocks are nowhere near their bubble highs.
The point? When the cycle concludes- as it did in 1980, 1990, and 2000- it marks a peak for prices related to the theme that will stand for years-even decades- to come.
The problem (or opportunity, we suppose) is that the markets have returned to the old commodity/BRIC themes with a vengeance. Reports of a bubble in China’s real estate markets making the rounds this week suggest that the series of crises that washed over the economy and markets and, perhaps more importantly, dented year-end bonuses at the major investment banks were more of a flesh wound than a fatal goring.
The reason that we have been focusing on the potential for a ‘top’ in the Shanghai Comp. once again is that it feels as if the markets are going to have to work through the entire topping process a second time. Our thought was that a furious rally to a peak for the Shanghai Composite Index would mark an ‘echo boom’ of sorts that would eventually lead to a cycle-ending peak for the CRB Index. Assuming the Chinese stock market does not surge to new high this quarter then the argument exists and persists that the end-of-decade cyclical top began last summer with the Shanghai Comp. and will end once commodity prices turn lower as the U.S. dollar begins to strengthen.