Nov. 10 (Bloomberg) — Cisco Systems Inc., the largest maker of computer networking equipment, forecast sales for the current quarter that fell short of analysts’ estimates, sending the shares tumbling in after-hours trading.
Our intention was to show how the cyclical trend remains positive so we thought we should at least include the Cisco news given that the U.S. equity futures were somewhat soft after the close of the regular session.
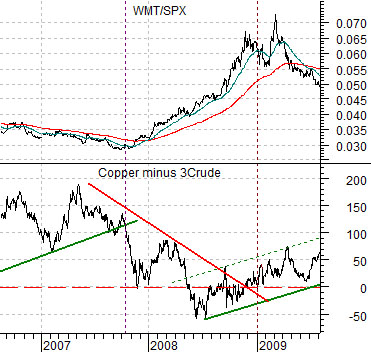
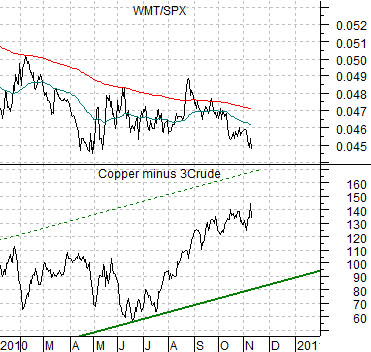
Below is a comparison between the spread of copper to crude oil futures (copper in cents minus crude oil dollars times 3) and the ratio between Wal Mart (WMT) and the S&P 500 Index from late 2006 into mid-2009.
The basic argument is that two things tend to happen when an Asian growth-driven cyclical trend starts to wane. First, copper prices begin to weaken relative to crude oil prices which pulls the spread between copper and crude oil lower. Second, the equity markets shift money towards some of the defensive themes and away from more risky ‘growth’ alternatives which leads to an upward swing for the WMT/SPX ratio.
The chart shows that while the copper minus crude oil spread peaked in the spring of 2007 it didn’t really break lower until the autumn and that this was confirmed by a rising trend for the WMT/SPX ratio. All of this happened around 9 months before the commodity and equity markets truly began to fall apart in mid-2008.
Next we have included a chart of the same comparison from the current time period.
What may (or may not) jump out from this chart is the fact that the spread between copper and crude oil is still strong and rising while the ratio between WMT and the SPX is still plodding along below the 200-day e.m.a. line. In other words even with Cisco’s share price taking a drubbing in late trading this is still a market running on a positive growth theme. Given that the tech sector has been lagging instead of leading we trust that the reaction to Cisco’s news will be temporary.
Equity/Bond Markets
You might think that it would be obvious when the markets changed themes. You might believe that you would recognize that trends had reversed almost immediately. Strange how well the markets obscure what is going on.
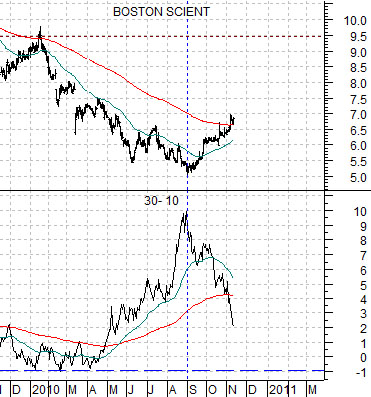
To explain… we have included a chart of Boston Scientific (BSX) and the price spread or difference between the 30-year and 10-year Treasury futures below.
The 30-10 spread goes ‘with’ bond prices. The spread rising when bond prices are rising and falls when bond prices are declining. It is merely another way of showing what is going on within the bond market.
So… at the end of August the markets reversed course. The bond market stopped rising and started to fall. The trend that was driving BSX lower reversed leading to higher prices. Over two months ago the markets changed themes almost completely.
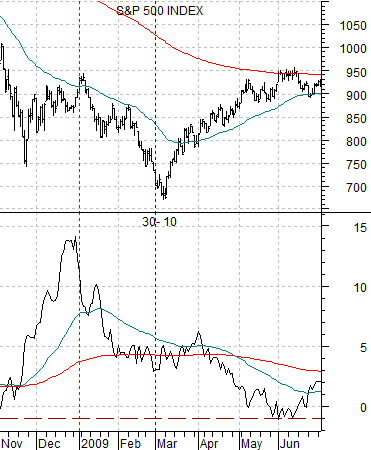
Is this important? We imagine that it is for all kinds of reasons but to start with we have included a chart of the 30-10 spread and the S&P 500 Index from the end of 2008 into 2009 at top right.
The point is that more than 2 months BEFORE the stock market began to rally in March of 2009 the bond market stopped rising in price and began to fall. The bond market was ‘saying’ that cyclical growth was improving even though the equity markets took more than 2 months to figure it all out.
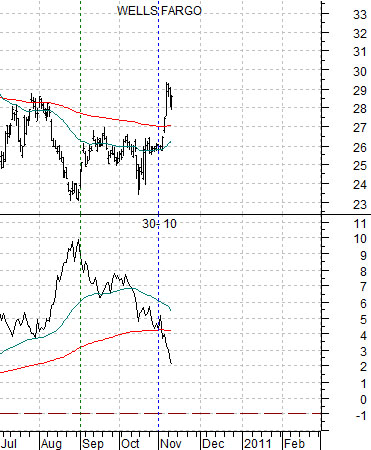
Below we feature the 30-10 spread and the share price of Wells Fargo (WFC). More than 2 months ago the bond market began to argue that growth was improving. In early November the market embraced the concept and started to bid the bank stocks higher. All things considered it is still rather difficult to be bearish on the equity markets even with China tightening credit and Cisco missing it’s sales forecast.